Nifty “falls hard, then rallies 200–300 from the low” — what is going on, and can an option buyer catch it live?
Built 2026-10-26 16:42 IST. Research only, not advice; read-only data, no orders. Asked 26-Oct-2026 12:41 IST: “today also 200 points move from bottom … there is something going on you are not able to analyze or catch”. Companion to flow forensics 12–23 Oct (which judged lows by the NEXT day; this page judges the SAME day).
Update 26-Oct-2026 (asked 16:20 IST): “call-wall cross squeeze” trigger tested on 2 years of 1-min option OI → section 8. Verdict: no out-of-sample edge for a buyer.
Plain answer.
- Yes, it is happening more — because the daily range has blown out, not because someone is reliably buying every low. In Oct-2026, 8 of 16 sessions recovered ≥200 pts from the intraday low (2022–25 average 19.8% of days; binomial p=0.007). But 13 of 16 October days had a ≥200-pt range (normal 38.6%, p=0.001). Of those big-range days, the share where the low came first and price recovered (a “V”) was 8/13 = 62% vs 51% normally (p=0.58, not unusual). The other October big days (8, 12, 19, 21-Oct) fell 200–420 and did not recover — they are easy to forget. Aug–Sep 2026 had almost none (1 of 42 days).
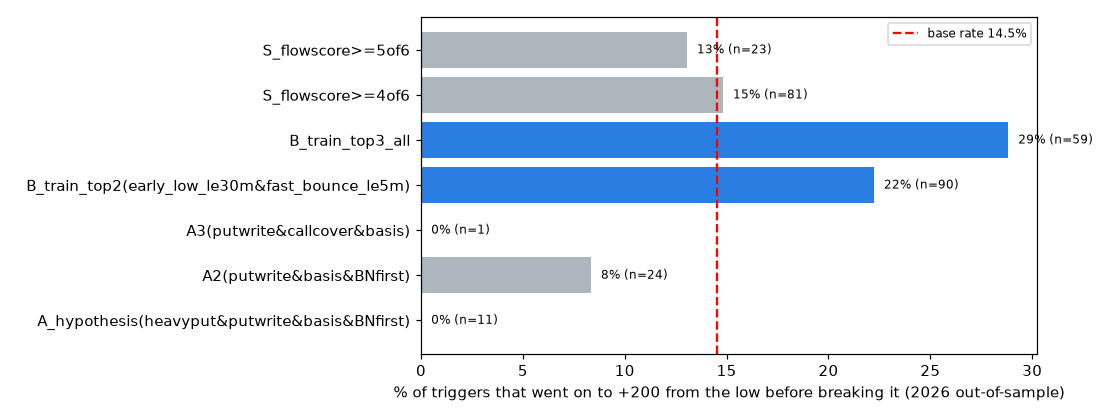
- The “someone is defending put strikes / call writers squeezed” story is real on individual days but does not predict the bounce. At the moment a live trader would act (first 30-pt bounce after a ≥120-pt fall), put-OI building, call-OI dropping, futures-basis widening, Bank Nifty bottoming first, VIX falling, straddle crush, a heavy put strike under the low — none separated winners from losers out-of-sample. The hypothesis rule (heavy put strike + put writing + basis widening + Bank Nifty first) fired 11 times in 2026 and hit 0 (base 14.5%).
- What did separate: timing and volatility, not flow. A 2024–25-trained rule — low made in the first 30 min, bounce of 30 pts within 5 min of the low, India VIX ≥ 14.46 — hit +200 from the low in 17/59 = 28.8% of 2026 triggers vs base 14.5% (binomial p=0.003, BH q=0.024, 99.9th percentile of random same-size picks). So it doubles the odds — but 7 of 10 triggers still fail.
- After costs, buying a call on it still does not make reliable money. ATM call, next-minute fill +3 slippage, real 1-min option bars, full Zerodha-style charges: OOS 2026 −4.4 to −6.7 pts/trade with stop/scale-out styles; only a “hold until spot +200 from low or spot breaks the low” runner (added after the first results — treat as exploratory) was +2.0 pts/trade (59 trades, +₹7,567/lot in 10 months, p=0.39 — indistinguishable from zero; it lost −10.4 pts/trade in 2024–25).
- A “call-writer squeeze” trigger (breakout above the post-low base while near-money call OI drops ≥2% in 5 min and basis widens ≥3) is the best flow signal found: 37% reach +200 from the low vs 18.6% for the same price breakout without the flow condition (2026 test, p=0.004). But it fires late (median +91 pts off the low), so the gain left is small: OOS trades −0.3 pts/trade (spot stop, 59 trades) — break-even, not an edge. Today it did not fire in time (the call covering started at 09:52 when price was already +143 off the low and accelerated after +150).
- Today 26-Oct: the timing rule fired twice: 09:16 at 22,510 (failed, −24 pts on the 22,500 CE) and 09:26 at 22,418, one minute after the 22,387 low (Bank Nifty bottomed 09:25), next-minute fill on 22,400 CE ≈173.6 → +23 (scale-out), +131 (runner, out at 09:56 when spot hit +200) or +188 (60-min hold). Net of both triggers: positive today — but the same rule loses on most days in the record.
Bottom line: the thing you are seeing is a high-volatility regime (VIX 16–18) where intraday swings of 200–400 happen almost daily in either direction. In that regime, an early-session low with a sharp first bounce is the best (still only ~30%) tell. Order-flow footprints are visible
after the move starts, not before.
1. How often does a ≥200-pt same-day recovery happen?
Event = Nifty spot rallies ≥X pts from its intraday low (09:15–15:14; spot 15:15–15:29 frozen since 03-Aug-2026, so excluded for all years). Source: 1-min Nifty 2022-01-03 → 2026-10-23 + today (Upstox intraday, to 12:42 IST). ev_0p9pct = recovery ≥0.9% (≈200 pts at today’s level). v_share_of_big = of days with ≥200 range, % where the ≥200 move was low-first.
| year |
days |
ev150 |
ev200 |
ev250 |
ev_0p9pct |
sharp_fall |
ev200_given_fall |
med_range |
big_range |
v_share_of_big |
med_rec |
| 2022 |
247.0 |
37.2 |
21.1 |
10.5 |
36.4 |
49.8 |
20.3 |
182.8 |
41.3 |
51.0 |
126.1 |
| 2023 |
245.0 |
22.0 |
6.1 |
1.6 |
13.5 |
26.5 |
7.7 |
136.2 |
14.7 |
41.7 |
98.4 |
| 2024 |
246.0 |
39.4 |
26.0 |
17.5 |
24.0 |
50.4 |
25.0 |
198.4 |
49.2 |
52.9 |
124.1 |
| 2025 |
248.0 |
41.1 |
25.8 |
13.3 |
21.4 |
47.6 |
18.6 |
197.5 |
49.2 |
52.5 |
130.7 |
| 2026 |
201.0 |
39.3 |
27.9 |
20.4 |
25.9 |
63.7 |
29.7 |
211.1 |
53.7 |
51.9 |
120.0 |
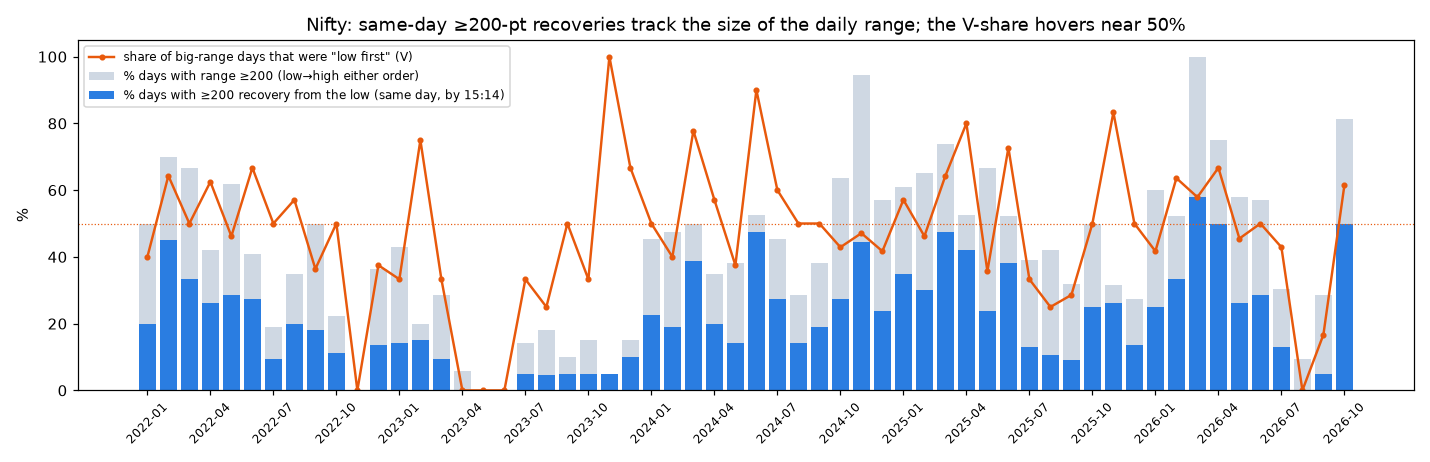
Last 15 months
| ym |
days |
ev150 |
ev200 |
ev250 |
ev_0p9pct |
sharp_fall |
ev200_given_fall |
med_range |
big_range |
v_share_of_big |
med_rec |
| 2025-08 |
19.0 |
21.1 |
10.5 |
10.5 |
10.5 |
47.4 |
11.1 |
169.2 |
42.1 |
25.0 |
80.7 |
| 2025-09 |
22.0 |
22.7 |
9.1 |
0.0 |
0.0 |
36.4 |
0.0 |
160.7 |
31.8 |
28.6 |
86.4 |
| 2025-10 |
20.0 |
45.0 |
25.0 |
10.0 |
15.0 |
35.0 |
0.0 |
196.3 |
50.0 |
50.0 |
141.7 |
| 2025-11 |
19.0 |
47.4 |
26.3 |
10.5 |
15.8 |
42.1 |
25.0 |
183.5 |
31.6 |
83.3 |
150.0 |
| 2025-12 |
22.0 |
27.3 |
13.6 |
0.0 |
0.0 |
40.9 |
0.0 |
159.1 |
27.3 |
50.0 |
113.7 |
| 2026-01 |
20.0 |
40.0 |
25.0 |
20.0 |
20.0 |
80.0 |
25.0 |
233.1 |
60.0 |
41.7 |
126.8 |
| 2026-02 |
21.0 |
42.9 |
33.3 |
23.8 |
23.8 |
66.7 |
35.7 |
211.9 |
52.4 |
63.6 |
119.6 |
| 2026-03 |
19.0 |
63.2 |
57.9 |
47.4 |
52.6 |
78.9 |
46.7 |
380.4 |
100.0 |
57.9 |
243.8 |
| 2026-04 |
20.0 |
65.0 |
50.0 |
35.0 |
50.0 |
65.0 |
46.2 |
268.5 |
75.0 |
66.7 |
207.2 |
| 2026-05 |
19.0 |
42.1 |
26.3 |
26.3 |
26.3 |
78.9 |
33.3 |
229.0 |
57.9 |
45.5 |
115.2 |
| 2026-06 |
21.0 |
38.1 |
28.6 |
23.8 |
28.6 |
66.7 |
21.4 |
218.0 |
57.1 |
50.0 |
138.5 |
| 2026-07 |
23.0 |
21.7 |
13.0 |
8.7 |
13.0 |
39.1 |
22.2 |
144.3 |
30.4 |
42.9 |
108.1 |
| 2026-08 |
21.0 |
4.8 |
0.0 |
0.0 |
0.0 |
33.3 |
0.0 |
125.0 |
9.5 |
0.0 |
77.8 |
| 2026-09 |
21.0 |
23.8 |
4.8 |
0.0 |
4.8 |
61.9 |
7.7 |
152.1 |
28.6 |
16.7 |
102.6 |
| 2026-10 |
16.0 |
62.5 |
50.0 |
25.0 |
50.0 |
75.0 |
41.7 |
324.5 |
81.2 |
61.5 |
196.7 |
Every October-2026 session
| date |
gap |
open |
low |
t_low |
fall_pc |
rec |
t_rechigh |
rng |
ev200 |
| Thu 01-Oct |
-76.8 |
22,543.7 |
22,217.3 |
14:05 |
403.2 |
231.2 |
15:14 |
393.3 |
True |
| Mon 05-Oct |
110.5 |
22,532.4 |
22,397.1 |
12:08 |
24.9 |
172.3 |
13:45 |
224.7 |
False |
| Tue 06-Oct |
47.5 |
22,603.2 |
22,561.6 |
09:16 |
-5.8 |
170.2 |
14:07 |
170.2 |
False |
| Wed 07-Oct |
-85.6 |
22,690.5 |
22,546.3 |
14:00 |
229.8 |
102.5 |
14:29 |
171.4 |
False |
| Thu 08-Oct |
-4.0 |
22,599.0 |
22,179.9 |
15:09 |
423.1 |
35.9 |
15:14 |
419.1 |
False |
| Fri 09-Oct |
83.2 |
22,315.0 |
22,294.8 |
09:25 |
-63.0 |
286.0 |
14:18 |
286.0 |
True |
| Mon 12-Oct |
72.8 |
22,593.2 |
22,304.5 |
15:10 |
216.0 |
22.1 |
15:14 |
346.6 |
False |
| Tue 13-Oct |
0.8 |
22,364.2 |
22,288.5 |
09:15 |
74.9 |
430.8 |
15:12 |
430.8 |
True |
| Wed 14-Oct |
-6.2 |
22,715.8 |
22,559.0 |
13:15 |
163.0 |
108.6 |
13:56 |
199.0 |
False |
| Thu 15-Oct |
48.6 |
22,671.3 |
22,637.4 |
09:15 |
-14.7 |
419.0 |
13:38 |
419.0 |
True |
| Fri 16-Oct |
67.8 |
23,065.1 |
22,913.8 |
09:36 |
83.5 |
236.0 |
10:36 |
236.0 |
True |
| Mon 19-Oct |
4.7 |
23,150.8 |
22,845.0 |
13:47 |
301.2 |
55.7 |
14:57 |
330.2 |
False |
| Wed 21-Oct |
127.0 |
23,016.0 |
22,649.9 |
14:47 |
239.0 |
94.4 |
15:14 |
471.0 |
False |
| Thu 22-Oct |
-123.6 |
22,687.8 |
22,554.8 |
09:35 |
256.5 |
230.2 |
11:14 |
230.2 |
True |
| Fri 23-Oct |
54.5 |
22,742.2 |
22,372.0 |
12:51 |
315.7 |
221.0 |
13:45 |
415.2 |
True |
| Mon 26-Oct |
-75.6 |
22,524.4 |
22,387.3 |
09:26 |
212.7 |
318.8 |
10:08 |
318.8 |
True |
2. What looked different at the actual day low (hindsight)
Sharp-fall days (≥150 from prior close or from the high before the low) since 21-Oct-2024 with option-OI data. Naive comparison (recovered ≥200 vs recovered <100) — almost everything “differs”, but it is mostly because the non-recovery lows are made at the end of the day (median 14:51), when OI, VIX and time-left all behave differently:
| metric |
recovered_median |
norecovery_median |
n_rec |
n_norec |
p_mwu |
q_bh |
| low_min |
50.000 |
336.500 |
68 |
130 |
0.000 |
0.000 |
| depth_pc |
197.075 |
188.175 |
68 |
130 |
0.601 |
0.707 |
| gap |
-43.675 |
-14.125 |
68 |
130 |
0.043 |
0.067 |
| round_dist |
26.575 |
25.125 |
68 |
130 |
0.846 |
0.899 |
| basis_chg_low_to+10 |
-2.525 |
-0.900 |
66 |
127 |
0.358 |
0.512 |
| basis_chg_-10_to_low |
0.000 |
2.700 |
66 |
127 |
0.037 |
0.062 |
| futoi_chg_low_to+15_pct |
0.158 |
0.140 |
66 |
127 |
0.571 |
0.707 |
| vix_chg_low_to+15 |
-0.140 |
-0.060 |
68 |
130 |
0.001 |
0.002 |
| vix_lvl |
16.080 |
13.640 |
68 |
130 |
0.000 |
0.000 |
| bn_low_minus_nifty_low_min |
0.000 |
-1.000 |
68 |
130 |
0.001 |
0.002 |
| dte |
2.500 |
2.000 |
68 |
130 |
0.854 |
0.899 |
| put_oi_chg_-10_to_+15_pct |
15.142 |
-4.795 |
68 |
129 |
0.000 |
0.000 |
| call_oi_chg_low_to+30_pct |
2.186 |
-3.518 |
68 |
129 |
0.000 |
0.000 |
| call_oi_chg_-10_to_low_pct |
3.853 |
-1.250 |
68 |
129 |
0.000 |
0.000 |
| heavy_put_dist |
-2.625 |
-1.600 |
68 |
129 |
0.942 |
0.942 |
| share_gap_down |
50.000 |
29.231 |
68 |
130 |
0.005 |
0.009 |
| share_dte0 |
20.588 |
25.385 |
68 |
130 |
0.487 |
0.649 |
| share_low_before_1000 |
48.529 |
0.000 |
68 |
130 |
0.000 |
0.000 |
| share_heavy_put_within40 |
27.941 |
51.538 |
68 |
130 |
0.002 |
0.004 |
| share_bn_first |
33.824 |
56.154 |
68 |
130 |
0.004 |
0.009 |
Time-matched (only lows made by 12:00): 59 recovered vs 30 did not — 66% of sharp-fall days whose low was in by noon recovered ≥200, but nothing measured at the low separated the two groups (all BH q ≥ 0.39). Weakest-but-present: higher VIX level (16.1 vs 14.7, p=0.019), basis rising into the low slightly less on recovery days (p=0.05).
| metric |
recovered |
not_recovered |
p |
q_bh |
n_rec |
n_not |
| low_min |
41.000 |
50.000 |
0.087 |
0.471 |
59 |
30 |
| depth_pc |
184.450 |
182.325 |
0.422 |
0.603 |
59 |
30 |
| gap |
-50.350 |
-32.375 |
0.518 |
0.691 |
59 |
30 |
| round_dist |
26.600 |
21.200 |
0.120 |
0.471 |
59 |
30 |
| basis_chg_low_to+10 |
-2.050 |
0.225 |
0.340 |
0.577 |
59 |
30 |
| basis_chg_-10_to_low |
0.000 |
1.675 |
0.051 |
0.471 |
59 |
30 |
| futoi_chg_low_to+15_pct |
0.103 |
0.310 |
0.183 |
0.471 |
59 |
30 |
| vix_chg_low_to+15 |
-0.150 |
-0.115 |
0.993 |
0.993 |
59 |
30 |
| vix_lvl |
16.120 |
14.725 |
0.019 |
0.387 |
59 |
30 |
| bn_low_minus_nifty_low_min |
0.000 |
0.000 |
0.972 |
0.993 |
59 |
30 |
| dte |
2.000 |
1.500 |
0.199 |
0.471 |
59 |
30 |
| put_oi_chg_-10_to_+15_pct |
18.058 |
3.830 |
0.216 |
0.471 |
59 |
30 |
| call_oi_chg_low_to+30_pct |
2.958 |
3.760 |
0.674 |
0.842 |
59 |
30 |
| call_oi_chg_-10_to_low_pct |
4.636 |
3.000 |
0.188 |
0.471 |
59 |
30 |
| heavy_put_dist |
0.200 |
-2.075 |
0.914 |
0.993 |
59 |
30 |
| share_gap_down |
50.847 |
40.000 |
0.375 |
0.577 |
59 |
30 |
| share_dte0 |
20.339 |
33.333 |
0.201 |
0.471 |
59 |
30 |
| share_heavy_put_within40 |
28.814 |
43.333 |
0.236 |
0.471 |
59 |
30 |
| share_bn_first |
37.288 |
40.000 |
0.821 |
0.966 |
59 |
30 |
| share_low_before_0945 |
45.763 |
33.333 |
0.363 |
0.577 |
59 |
30 |
3. Live detector (only data known at the trigger minute)
Candidate = after a ≥120-pt fall (from the higher of prior close or the session high before the low), the first 1-min close ≥30 pts above the running low within 15 min of that low (one per low; a new low ≥5 pts lower re-arms; max 3/day; triggers up to 14:14). Success = high reaches low+200 before price breaks low−5, by 15:14. 551 triggers on 291 days, 21-Oct-2024 → 26-Oct-2026. Train 2024-10-21…2025-12-31 (n=303, base 13.5%); test 2026-01-01…2026-10-26 (n=248, base 14.5%). Flow features: put OI over the 4 strikes around the low and call OI over 4 strikes 100–250 above (nearest weekly expiry, 1-min OI), from 10 min before the low to the trigger; basis = front-month future − spot; Bank Nifty and VIX 1-min from Upstox.
Single features (Fisher exact; BH across 21 features)
| feature |
n_true_train |
hit_true_train |
hit_false_train |
p_train |
n_true_test |
hit_true_test |
hit_false_test |
p_test |
q_bh_test |
| early_low_le30m |
91.000 |
25.275 |
8.491 |
0.000 |
101.000 |
20.792 |
10.204 |
0.027 |
0.142 |
| fast_bounce_le5m |
195.000 |
18.462 |
4.630 |
0.001 |
183.000 |
18.579 |
3.077 |
0.002 |
0.017 |
| vix_high |
152.000 |
19.737 |
7.285 |
0.002 |
146.000 |
20.548 |
5.882 |
0.002 |
0.017 |
| fast_fall |
152.000 |
18.421 |
8.609 |
0.018 |
125.000 |
20.800 |
8.130 |
0.006 |
0.044 |
| futoi_down |
50.000 |
4.000 |
16.071 |
0.024 |
49.000 |
8.163 |
16.080 |
0.182 |
0.370 |
| gap_down |
81.000 |
19.753 |
11.261 |
0.060 |
109.000 |
19.266 |
10.791 |
0.070 |
0.213 |
| bn_first |
128.000 |
10.156 |
16.000 |
0.174 |
101.000 |
13.861 |
14.966 |
0.856 |
0.946 |
| vix_falling |
238.000 |
12.185 |
18.462 |
0.219 |
197.000 |
15.228 |
11.765 |
0.658 |
0.813 |
| put_writing |
139.000 |
11.511 |
16.026 |
0.313 |
122.000 |
18.852 |
10.318 |
0.071 |
0.213 |
| call_cover |
22.000 |
4.545 |
14.652 |
0.333 |
19.000 |
10.526 |
14.847 |
1.000 |
1.000 |
| straddle_crush |
237.000 |
13.080 |
17.241 |
0.402 |
194.000 |
13.402 |
18.518 |
0.383 |
0.545 |
| deep_fall_ge200 |
69.000 |
15.942 |
12.820 |
0.548 |
92.000 |
18.478 |
12.180 |
0.194 |
0.370 |
| heavy_put_near |
94.000 |
11.702 |
14.925 |
0.588 |
95.000 |
8.421 |
18.301 |
0.041 |
0.170 |
| expiry_le1 |
111.000 |
11.712 |
14.583 |
0.602 |
102.000 |
18.628 |
11.644 |
0.144 |
0.336 |
| round_low_le20 |
116.000 |
14.655 |
12.834 |
0.730 |
99.000 |
14.141 |
14.765 |
1.000 |
1.000 |
| thursday |
49.000 |
14.286 |
13.386 |
0.822 |
51.000 |
19.608 |
13.198 |
0.267 |
0.467 |
| expiry_day |
59.000 |
11.864 |
13.934 |
0.833 |
55.000 |
18.182 |
13.472 |
0.389 |
0.545 |
| basis_widen |
130.000 |
13.077 |
13.873 |
0.867 |
118.000 |
12.712 |
16.154 |
0.475 |
0.623 |
| below_pdl |
186.000 |
13.441 |
13.675 |
1.000 |
138.000 |
16.667 |
11.818 |
0.365 |
0.545 |
| basis_widen_big |
67.000 |
13.433 |
13.559 |
1.000 |
53.000 |
15.094 |
14.359 |
0.830 |
0.946 |
| put_writing_big |
89.000 |
13.483 |
14.078 |
1.000 |
84.000 |
20.238 |
11.585 |
0.086 |
0.226 |
Rules — hit rate vs base, binomial p, percentile vs 5,000 random same-size picks
| rule |
split |
n_fire |
days |
hits |
hit_rate |
base |
p_binom |
random_pctile |
random_p95 |
q_bh_test |
| A_hypothesis(heavyput&putwrite&basis&BNfirst) |
train |
11 |
11 |
2 |
18.182 |
13.531 |
0.450 |
56.220 |
27.273 |
– |
| A_hypothesis(heavyput&putwrite&basis&BNfirst) |
test |
11 |
11 |
0 |
0.000 |
14.516 |
1.000 |
0.000 |
36.364 |
1.000 |
| A_hypothesis(heavyput&putwrite&basis&BNfirst) |
all |
22 |
22 |
2 |
9.091 |
13.975 |
0.833 |
15.560 |
27.273 |
– |
| A2(putwrite&basis&BNfirst) |
train |
33 |
30 |
3 |
9.091 |
13.531 |
0.843 |
14.720 |
24.242 |
– |
| A2(putwrite&basis&BNfirst) |
test |
24 |
23 |
2 |
8.333 |
14.516 |
0.882 |
10.940 |
25.000 |
1.000 |
| A2(putwrite&basis&BNfirst) |
all |
57 |
53 |
5 |
8.772 |
13.975 |
0.915 |
7.040 |
21.053 |
– |
| A3(putwrite&callcover&basis) |
train |
3 |
3 |
0 |
0.000 |
13.531 |
1.000 |
0.000 |
33.333 |
– |
| A3(putwrite&callcover&basis) |
test |
1 |
1 |
0 |
0.000 |
14.516 |
1.000 |
0.000 |
100.000 |
1.000 |
| A3(putwrite&callcover&basis) |
all |
4 |
4 |
0 |
0.000 |
13.975 |
1.000 |
0.000 |
50.000 |
– |
| B_train_top2(early_low_le30m&fast_bounce_le5m) |
train |
77 |
65 |
21 |
27.273 |
13.531 |
0.001 |
100.000 |
19.480 |
– |
| B_train_top2(early_low_le30m&fast_bounce_le5m) |
test |
90 |
76 |
20 |
22.222 |
14.516 |
0.032 |
98.880 |
20.000 |
0.113 |
| B_train_top2(early_low_le30m&fast_bounce_le5m) |
all |
167 |
141 |
41 |
24.551 |
13.975 |
0.000 |
100.000 |
17.365 |
– |
| B_train_top3_all |
train |
57 |
47 |
15 |
26.316 |
13.531 |
0.007 |
99.680 |
21.053 |
– |
| B_train_top3_all |
test |
59 |
48 |
17 |
28.814 |
14.516 |
0.004 |
99.900 |
22.034 |
0.024 |
| B_train_top3_all |
all |
116 |
95 |
32 |
27.586 |
13.975 |
0.000 |
100.000 |
18.965 |
– |
| S_flowscore>=4of6 |
train |
103 |
79 |
10 |
9.709 |
13.531 |
0.904 |
5.240 |
18.447 |
– |
| S_flowscore>=4of6 |
test |
81 |
62 |
12 |
14.815 |
14.516 |
0.517 |
46.500 |
19.753 |
1.000 |
| S_flowscore>=4of6 |
all |
184 |
141 |
22 |
11.957 |
13.975 |
0.814 |
13.420 |
17.391 |
– |
| S_flowscore>=5of6 |
train |
25 |
24 |
3 |
12.000 |
13.531 |
0.676 |
29.740 |
24.000 |
– |
| S_flowscore>=5of6 |
test |
23 |
22 |
3 |
13.043 |
14.516 |
0.669 |
31.000 |
26.087 |
1.000 |
| S_flowscore>=5of6 |
all |
48 |
46 |
6 |
12.500 |
13.975 |
0.678 |
30.460 |
22.917 |
– |
“Call-writer squeeze” trigger vs the same price breakout
All breakouts to a new post-low closing high, 40–150 pts above the low, ≥5 min after it. Price-only = first such breakout per low; squeeze = first one with near-money call OI −2% or more in 5 min AND basis +3 or more in 5 min (hypothesis taken from the 23-Oct who-flow finding; 23/26-Oct excluded in one row to avoid self-confirmation).
| kind |
split |
n |
y200 |
y_entry100 |
med_gain_entry |
med_mae60 |
med_run_at_entry |
med_base_min |
| basis_widen_first |
train |
159 |
18.87 |
26.42 |
43.05 |
35.00 |
55.65 |
19.00 |
| basis_widen_first |
test |
151 |
24.50 |
28.48 |
41.15 |
41.20 |
56.20 |
17.00 |
| basis_widen_first |
test_excl_23_26Oct |
148 |
23.65 |
27.70 |
40.70 |
40.98 |
55.90 |
17.50 |
| basis_widen_first |
all |
310 |
21.61 |
27.42 |
41.60 |
37.77 |
56.17 |
18.00 |
| call_oi_drop_first |
train |
109 |
29.36 |
33.03 |
48.15 |
35.95 |
75.60 |
27.00 |
| call_oi_drop_first |
test |
83 |
32.53 |
36.14 |
63.70 |
35.60 |
80.35 |
27.00 |
| call_oi_drop_first |
test_excl_23_26Oct |
82 |
31.71 |
36.59 |
63.00 |
35.33 |
80.25 |
27.00 |
| call_oi_drop_first |
all |
192 |
30.73 |
34.38 |
58.55 |
35.73 |
78.68 |
27.00 |
| price_breakout_first |
train |
283 |
14.49 |
22.26 |
39.20 |
39.00 |
45.35 |
11.00 |
| price_breakout_first |
test |
221 |
18.55 |
24.43 |
38.65 |
39.55 |
45.65 |
10.00 |
| price_breakout_first |
test_excl_23_26Oct |
216 |
18.06 |
24.07 |
39.25 |
39.42 |
45.52 |
10.00 |
| price_breakout_first |
all |
504 |
16.27 |
23.21 |
39.12 |
39.12 |
45.48 |
10.00 |
| squeeze_flow_first |
train |
57 |
36.84 |
35.09 |
65.95 |
32.80 |
92.65 |
39.00 |
| squeeze_flow_first |
test |
59 |
37.29 |
37.29 |
74.60 |
35.50 |
91.15 |
37.00 |
| squeeze_flow_first |
test_excl_23_26Oct |
58 |
36.21 |
37.93 |
73.67 |
35.27 |
91.00 |
36.00 |
| squeeze_flow_first |
all |
116 |
37.07 |
36.21 |
69.45 |
34.12 |
91.75 |
37.00 |
4. Option-buyer trades (after costs)
ATM CE (strike = trigger close rounded to 50), nearest weekly expiry (skip-0DTE version in CSV — same picture). Fill = next minute’s open + 3 pts; exits − 3 pts; charges: ₹20/order brokerage, STT 0.1% on sells, exchange 0.03503%, SEBI, stamp 0.003% on buys, 18% GST; lot 75 (65 from Jan-2026). Styles: sl_only −20 premium stop, 60-min time exit; scale 40% at +20, 30% at +40, trail; spotstop exit if spot breaks the low (−40 premium backstop) + scale; runner exit when spot reaches low+200 or breaks the low (−35 backstop), else 15:14 (added after first results). Random benchmark = 2,974 random minutes 09:20–14:14 on the same days.
| group |
split |
style |
n |
mean_pts |
median_pts |
win_pct |
total_rs_1lot |
avg_cost_pts |
random_mean |
pctile_vs_random |
p_mean_gt0 |
| all_candidates |
train |
runner |
295 |
-8.01 |
-24.36 |
22.37 |
-154,246.79 |
1.01 |
-9.03 |
72.50 |
1.00 |
| all_candidates |
train |
scale |
295 |
-7.57 |
-20.85 |
37.63 |
-151,874.27 |
1.23 |
-7.75 |
56.80 |
1.00 |
| all_candidates |
train |
sl_only |
295 |
-6.83 |
-23.75 |
25.42 |
-128,910.93 |
1.01 |
-7.34 |
62.17 |
1.00 |
| all_candidates |
train |
spotstop |
295 |
-8.18 |
-13.96 |
40.34 |
-166,506.58 |
1.24 |
-8.06 |
44.63 |
1.00 |
| all_candidates |
test |
runner |
248 |
-8.27 |
-25.43 |
22.18 |
-133,246.42 |
1.00 |
-9.03 |
65.73 |
1.00 |
| all_candidates |
test |
scale |
248 |
-8.57 |
-23.80 |
36.69 |
-138,140.55 |
1.18 |
-7.75 |
23.27 |
1.00 |
| all_candidates |
test |
sl_only |
248 |
-7.19 |
-23.88 |
25.40 |
-115,882.21 |
1.00 |
-7.34 |
55.20 |
1.00 |
| all_candidates |
test |
spotstop |
248 |
-8.57 |
-15.91 |
40.73 |
-138,093.50 |
1.20 |
-8.06 |
36.70 |
1.00 |
| all_candidates |
all |
runner |
543 |
-8.13 |
-24.78 |
22.28 |
-287,493.21 |
1.01 |
-9.03 |
75.27 |
1.00 |
| all_candidates |
all |
scale |
543 |
-8.03 |
-23.69 |
37.20 |
-290,014.81 |
1.20 |
-7.75 |
36.63 |
1.00 |
| all_candidates |
all |
sl_only |
543 |
-6.99 |
-23.81 |
25.41 |
-244,793.14 |
1.01 |
-7.34 |
61.70 |
1.00 |
| all_candidates |
all |
spotstop |
543 |
-8.36 |
-14.81 |
40.52 |
-304,600.09 |
1.22 |
-8.06 |
36.93 |
1.00 |
| rule_B_top3 |
train |
runner |
57 |
-10.43 |
-26.64 |
24.56 |
-34,496.10 |
1.25 |
-9.03 |
38.87 |
0.96 |
| rule_B_top3 |
train |
scale |
57 |
-10.63 |
-23.79 |
33.33 |
-37,811.52 |
1.54 |
-7.75 |
11.73 |
1.00 |
| rule_B_top3 |
train |
sl_only |
57 |
-10.94 |
-23.92 |
19.30 |
-40,334.58 |
1.25 |
-7.34 |
13.73 |
0.99 |
| rule_B_top3 |
train |
spotstop |
57 |
-11.07 |
-20.12 |
42.10 |
-41,163.72 |
1.58 |
-8.06 |
14.70 |
1.00 |
| rule_B_top3 |
test |
runner |
59 |
1.97 |
-23.77 |
28.81 |
7,566.53 |
1.07 |
-9.03 |
99.30 |
0.39 |
| rule_B_top3 |
test |
scale |
59 |
-6.59 |
-23.85 |
47.46 |
-25,259.75 |
1.30 |
-7.75 |
70.53 |
0.99 |
| rule_B_top3 |
test |
sl_only |
59 |
-6.74 |
-23.96 |
25.42 |
-25,851.38 |
1.06 |
-7.34 |
58.90 |
0.92 |
| rule_B_top3 |
test |
spotstop |
59 |
-4.43 |
3.52 |
59.32 |
-17,005.68 |
1.37 |
-8.06 |
91.17 |
0.92 |
| rule_B_top3 |
all |
runner |
116 |
-4.12 |
-26.29 |
26.72 |
-26,929.57 |
1.16 |
-9.03 |
93.87 |
0.82 |
| rule_B_top3 |
all |
scale |
116 |
-8.57 |
-23.84 |
40.52 |
-63,071.27 |
1.42 |
-7.75 |
29.63 |
1.00 |
| rule_B_top3 |
all |
sl_only |
116 |
-8.80 |
-23.93 |
22.41 |
-66,185.96 |
1.16 |
-7.34 |
28.17 |
1.00 |
| rule_B_top3 |
all |
spotstop |
116 |
-7.70 |
1.85 |
50.86 |
-58,169.40 |
1.48 |
-8.06 |
57.43 |
1.00 |
| rule_A_hypothesis |
train |
runner |
11 |
28.34 |
18.36 |
54.55 |
24,835.17 |
0.98 |
-9.03 |
99.80 |
0.07 |
| rule_A_hypothesis |
train |
scale |
11 |
-0.73 |
-9.42 |
45.45 |
653.24 |
1.14 |
-7.75 |
89.57 |
0.54 |
| rule_A_hypothesis |
train |
sl_only |
11 |
3.73 |
-9.42 |
45.45 |
4,335.46 |
0.95 |
-7.34 |
92.10 |
0.35 |
| rule_A_hypothesis |
train |
spotstop |
11 |
5.73 |
3.52 |
54.55 |
6,183.22 |
1.18 |
-8.06 |
98.43 |
0.21 |
| rule_A_hypothesis |
test |
runner |
11 |
-23.70 |
-29.02 |
9.09 |
-16,943.42 |
0.93 |
-9.03 |
4.17 |
1.00 |
| rule_A_hypothesis |
test |
scale |
11 |
-14.20 |
-23.80 |
27.27 |
-10,153.21 |
1.01 |
-7.75 |
11.97 |
0.99 |
| rule_A_hypothesis |
test |
sl_only |
11 |
-16.87 |
-23.85 |
18.18 |
-12,062.34 |
0.94 |
-7.34 |
6.87 |
1.00 |
| rule_A_hypothesis |
test |
spotstop |
11 |
-17.84 |
-24.53 |
27.27 |
-12,759.27 |
1.01 |
-8.06 |
6.00 |
0.99 |
| rule_A_hypothesis |
all |
runner |
22 |
2.32 |
-18.69 |
31.82 |
7,891.75 |
0.96 |
-9.03 |
92.93 |
0.41 |
| rule_A_hypothesis |
all |
scale |
22 |
-7.47 |
-20.95 |
36.36 |
-9,499.97 |
1.08 |
-7.75 |
52.57 |
0.94 |
| rule_A_hypothesis |
all |
sl_only |
22 |
-6.57 |
-23.73 |
31.82 |
-7,726.88 |
0.95 |
-7.34 |
60.40 |
0.88 |
| rule_A_hypothesis |
all |
spotstop |
22 |
-6.06 |
-12.88 |
40.91 |
-6,576.04 |
1.09 |
-8.06 |
67.83 |
0.88 |
Timing rule (B) per year and per month (pts per trade, sum)
| style |
year |
n |
mean_pts |
win |
rs |
| runner |
2024 |
21 |
-5.9 |
19.0 |
823.7 |
| runner |
2025 |
36 |
-13.1 |
27.8 |
-35,319.8 |
| runner |
2026 |
59 |
2.0 |
28.8 |
7,566.5 |
| scale |
2024 |
21 |
-9.3 |
38.1 |
-7,047.9 |
| scale |
2025 |
36 |
-11.4 |
30.6 |
-30,763.6 |
| scale |
2026 |
59 |
-6.6 |
47.5 |
-25,259.7 |
| sl_only |
2024 |
21 |
-7.5 |
23.8 |
-5,366.1 |
| sl_only |
2025 |
36 |
-13.0 |
16.7 |
-34,968.5 |
| sl_only |
2026 |
59 |
-6.7 |
25.4 |
-25,851.4 |
| spotstop |
2024 |
21 |
-9.6 |
42.9 |
-8,972.8 |
| spotstop |
2025 |
36 |
-11.9 |
41.7 |
-32,190.9 |
| spotstop |
2026 |
59 |
-4.4 |
59.3 |
-17,005.7 |
| style |
ym |
trades |
runner |
scale |
sl_only |
spotstop |
|
2024-10 |
7 |
-52.4 |
-79.3 |
19.1 |
-54.1 |
|
2024-11 |
12 |
-101.2 |
-116.5 |
-210.8 |
-128.1 |
|
2024-12 |
2 |
30.0 |
0.3 |
34.5 |
-19.7 |
|
2025-01 |
6 |
-101.8 |
-95.7 |
-143.6 |
-18.6 |
|
2025-02 |
8 |
56.4 |
-90.4 |
-120.9 |
-100.7 |
|
2025-04 |
6 |
-214.1 |
-88.3 |
-97.0 |
-127.0 |
|
2025-05 |
12 |
-155.9 |
-142.6 |
-141.4 |
-174.8 |
|
2025-06 |
4 |
-55.5 |
6.8 |
36.6 |
-8.1 |
|
2026-01 |
1 |
116.7 |
-23.9 |
-23.9 |
33.9 |
|
2026-03 |
22 |
-126.2 |
-258.8 |
-344.8 |
-229.4 |
|
2026-04 |
9 |
-18.7 |
94.7 |
-3.0 |
84.0 |
|
2026-05 |
14 |
-138.6 |
-72.6 |
-73.8 |
-72.7 |
|
2026-06 |
6 |
246.8 |
-61.1 |
-51.0 |
-9.9 |
|
2026-10 |
7 |
36.5 |
-66.9 |
98.7 |
-67.6 |
Squeeze trigger trades
| kind |
test |
style |
n |
mean_pts |
median_pts |
win_pct |
total_rs_1lot |
| price_breakout_first |
train 2024-25 |
runner |
277 |
-9.67 |
-29.05 |
23.83 |
-181,886.77 |
| price_breakout_first |
train 2024-25 |
sl_only |
277 |
-7.87 |
-23.72 |
22.74 |
-144,816.78 |
| price_breakout_first |
train 2024-25 |
spotstop |
277 |
-10.03 |
-13.92 |
38.63 |
-192,118.32 |
| price_breakout_first |
test 2026 |
runner |
221 |
-6.23 |
-27.45 |
26.70 |
-89,471.49 |
| price_breakout_first |
test 2026 |
sl_only |
221 |
-6.56 |
-23.86 |
25.34 |
-94,293.51 |
| price_breakout_first |
test 2026 |
spotstop |
221 |
-7.25 |
-12.15 |
42.99 |
-104,155.35 |
| squeeze_flow_first |
train 2024-25 |
runner |
57 |
-1.27 |
-37.24 |
35.09 |
-7,370.25 |
| squeeze_flow_first |
train 2024-25 |
sl_only |
57 |
-4.58 |
-23.76 |
24.56 |
-17,582.04 |
| squeeze_flow_first |
train 2024-25 |
spotstop |
57 |
-6.71 |
-0.07 |
49.12 |
-27,458.13 |
| squeeze_flow_first |
test 2026 |
runner |
59 |
-4.63 |
-38.79 |
35.59 |
-17,752.68 |
| squeeze_flow_first |
test 2026 |
sl_only |
59 |
-1.54 |
-23.86 |
30.51 |
-5,893.98 |
| squeeze_flow_first |
test 2026 |
spotstop |
59 |
-0.31 |
3.58 |
54.24 |
-1,182.89 |
5. Today, 26-Oct-2026 (case study)
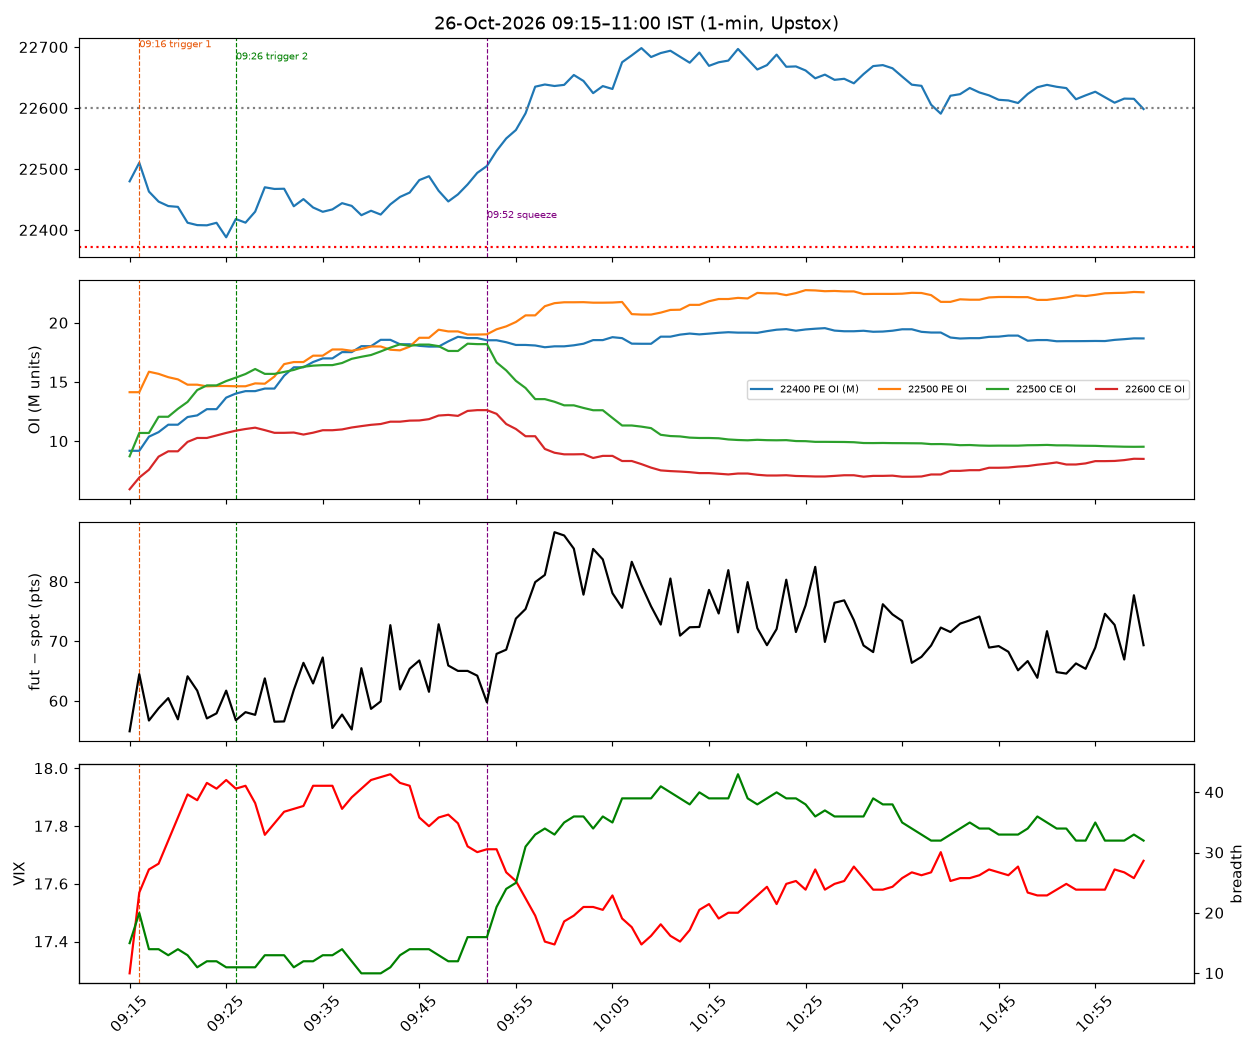
Prior close 22,600; open 22,524.4 (gap −75.6); low 22,387.35 at 09:26 (09:25 bar 22,387.45) — just above Friday’s low 22,372; Bank Nifty low 53,777.5 at 09:25 (1 min earlier); VIX peaked 18.00 at 09:43; high 22,706 at 10:08 (+319 from low); 12:42 at 22,600.
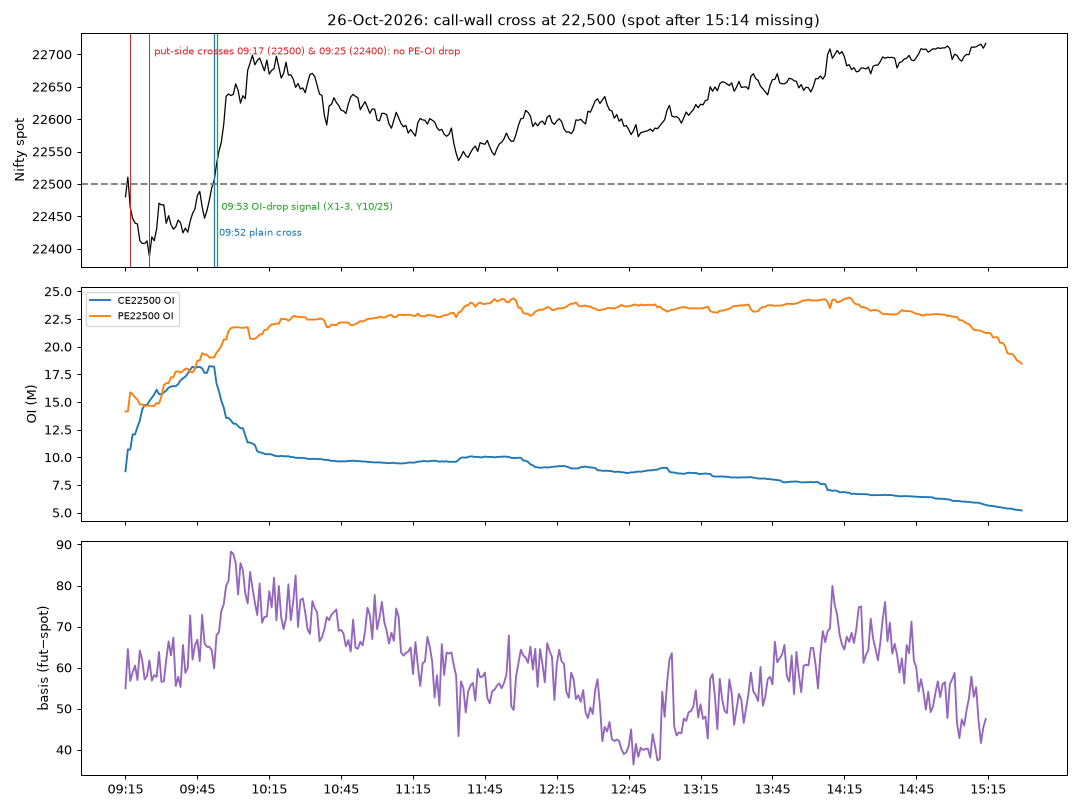
- 09:15–09:26 fall: call writers added (22500 CE OI 8.7M→15.4M) and put writers added at 22400 (9.2M→14.0M) — both sides writing, i.e. sellers expected a range around 22,400–22,500.
- 09:26–09:50 base (22,413–22,490): put OI at 22400 kept rising to 18.6M (put writing under the low), basis 55–73, breadth stuck at 10–14 of 50 stocks above their open. Heavyweights bottomed at different minutes (Bharti/ITC 09:25, L&T/Kotak 09:26, Reliance 09:27, HDFC Bank/ICICI 09:35, SBI 09:42) — not one synchronized basket buy at the low.
- 09:52–10:08 squeeze: 22500 CE OI 18.2M→11.2M and 22600 CE 12.6M→8.1M (call writers covering), basis 60→88, futures OI 11.17M→11.11M (short covering, not fresh longs), VIX 17.98→17.39, breadth 14→39 stocks. +250 pts in 16 minutes.
Detector rows today
| hm |
RL |
entry |
fall |
min_since_open |
bounce_min |
vix_lvl |
put_oi_chg_pct |
call_oi_chg_pct |
basis_chg |
bn_lead_min |
heavy_put_dist |
rule_B_train_top3_all |
rule_A_hypothesis |
maxrun |
y200 |
| 09:16 |
22,470.05 |
22,510.50 |
129.95 |
0 |
1 |
17.57 |
5.65 |
10.44 |
9.55 |
-1 |
-29.95 |
True |
False |
47.10 |
False |
| 09:26 |
22,387.35 |
22,418.20 |
212.65 |
11 |
0 |
17.93 |
35.26 |
56.99 |
-7.70 |
1 |
-112.65 |
True |
False |
318.80 |
True |
Timing rule B fired at 09:16 (failed: low later broke) and 09:26 (worked). Hypothesis rule A did not fire (basis was falling, heavy put strike 22500 was 113 pts above the low). Squeeze trigger did not fire within its +150 cap. Trades: 09:16 → 22500 CE fill 173.3, stopped −24 pts (−₹1,561/lot); 09:26 → 22400 CE fill 173.6: +23 (scale), +131 (runner), +188 (60-min hold).
6. Data gaps and caveats
- Spot 15:15–15:29 frozen since 03-Aug-2026 → all years cut at 15:14. Today’s data ends 12:42 IST (session not finished; today’s “recovery” uses the 10:08 high).
- Option OI history: local Upstox 1-min by-expiry files (expiries 03-Oct-2024 → 29-Sep-2026) + Upstox expired-instrument candles for Oct-2026 expiries (06/13/19-Oct) + live-listed 27-Oct/03-Nov contracts, strikes 21,600–23,600 for Oct. Flow detector sample therefore starts 21-Oct-2024 (2 years). 1-min OI from Upstox has known glitches (see flow-forensics 23-Oct note); not cleaned, not filled.
- Breadth and heavyweight synchrony only available for 08-Sep → 26-Oct-2026 (50-stock 1-min), so not in the 2-year detector; described for today only.
- Sensex Thursday expiry flag tested as a feature (‘thursday’); no BSE option data used.
- Costs are approximate retail charges; real slippage on fast bounce minutes can exceed 3 pts.
- Multiple-testing: 21 features × 2 periods; rule B was chosen on 2024–25 only and tested once on 2026. The runner exit style was added after seeing first results.
7. Files
results/ (day_events, freq_by_year/month, candidates, feature_univariate, rules_oos, trades_all, trade_summary, squeeze_*, day_low_*, today_minutes) · scripts/ · charts in charts/.
8. Call-wall cross squeeze trigger (tested 26-Oct-2026, asked 16:20 IST)
Built 2026-10-26 16:42 IST. Question: on 26-Oct the 22,500 call writers added OI while spot was below 22,500, then covered as soon as spot crossed it (CE22500 OI 18.2M→11.2M by 10:08, Nifty 22,505→22,699) while put writers built a floor at the same strike. Is “spot crosses the heaviest call strike + call OI drops right after” a tradeable trigger for an option buyer? Sample: every session with nearest-weekly 1-min option OI, 01-Oct-2024 → 26-Oct-2026 (430 days with a cross; 821 crosses). Train Oct-2024–Dec-2025, test 2026 (out of sample). Read-only, no orders, research only.
Plain answer: no edge. Today was a textbook case and it paid, but across two years the same trigger is a coin-flip that loses money after costs.
- Crossing the call wall is not special. In 2026, after spot closes above the heaviest call strike, it reaches +50 before −30 within 30 min 16% of the time, vs 19% for random entries at the same minute on other days. +100 before −30 within 60 min: 5.7% vs 7.2% random.
- Adding the call-OI drop, the put-writer floor and basis widening does not help out of sample. Across 88 variants × 12 outcomes, no 2026 result survives the Benjamini–Hochberg correction (smallest test q = 1.00). The few nominal p<0.05 results are variants with basis widening hitting less often than random (0 of 12–14), i.e. the opposite of the idea. In train (2024–25) the plain cross looked mildly better than random (+50/−30 in 30 min: 26.8% vs 20.1%, p=0.044) — that did not repeat in 2026 (16.0% vs 19.3%).
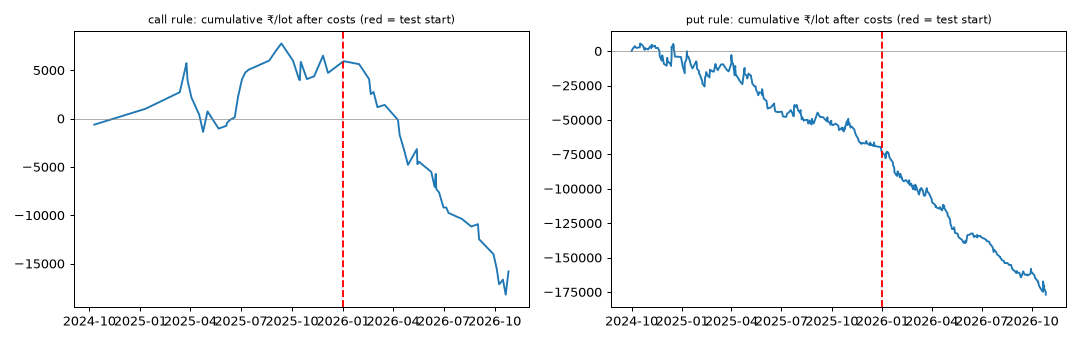
- Trade (rule fixed on train before looking at 2026): c_X2_Y25 on the dynamic wall — buy the crossed wall-strike CE at the next minute’s open +3 slippage, premium stop −20, sell 40% at +20, 30% at +40, trail the rest 20 below the peak, 60-min cap. Train: 30 trades, +1.5 pts/trade (cherry-picked out of 100 eligible combos). 2026: 33 trades, -9.6 pts/trade, win 33%, ₹-20,523/lot total — no better than the plain cross (-8.7) or random same-minute entries (-9.1). Mean significantly below zero (t-test p=0.003).
- Puts (mirror: spot crosses below heaviest put strike + put OI drops): no variant was positive even on train; best train combo was the plain cross with spot stop K+30 / target −150 at -3.9 pts/trade; 2026: 170 trades, -9.4 pts/trade, win 24%, ₹-103,424/lot. Fail.
- Expiry / pre-expiry days (gamma): worse, not better. Call rule 2026: expiry day -13.0 pts (n=10), pre-expiry -10.5 (n=7), other -7.0 (n=16).
- Today: the dynamic call wall was 22,500; spot crossed 09:52 (22,505); CE22500 OI fell 8.5% by 09:53 (−17% by 09:55) and PE22500 OI was +28.8% over the prior 30 min → plain cross, (b) X=1/2/3 and (c) Y=10/25 all fired; (d) did not (basis +2.0 in the 5 min to 09:53, below +3; the 60→88 widening came after). The fixed rule bought the 22500 CE at the 09:54 open (fill 181.8 incl. slippage): +37.1 pts net (≈₹2,410/lot of 65), out on the premium trail; a spot-target exit (+150) would have made +127.6. Spot reached +100 before −30 within 60 min. The put-side crosses at 09:17 (22,500) and 09:25 (22,400) had no put-OI drop (put writers were adding) so (b)–(d) did not fire; the put rule (plain cross) bought PE22500 at 09:18 and PE22400 at 09:26 and lost −44.9 and −27.2 pts net. One good day does not change the 2-year record — 23/26-Oct-excluded test is -11.0 pts/trade.
Bottom line: what you saw today — writers adding below the strike, covering above it — is visible on many days, but most of the time the cross stalls within 30–40 pts (median 60-min favourable move ≈33 pts, adverse ≈27–38 pts for every variant), which an ATM buyer cannot overcome after slippage and theta. Not a rule to trade.
Definitions (fixed before results)
- Dynamic call wall (minute t−1): strike with the highest CE OI among strikes from spot to spot+300 (nearest weekly expiry, 0DTE included). Fixed wall: highest-CE-OI strike above spot at 09:20 (search up to +1,000, the panel limit), fixed for the day. Puts mirror it (spot−300 … spot, PE OI).
- (a) spot 1-min close crosses the wall from below (first cross per strike per day, 09:16–14:14). (b) + wall CE OI falls ≥X% (X=1,2,3) vs the minute before the cross, at minute +1, +2 or +3 (signal = first such minute). (c) + PE OI at the same strike up ≥Y% (Y=10/25/50) over the 30 min before the cross. (d) + basis (front future − spot) widened ≥+3 over the 5 min to the signal. Y was moved from the planned 5/10 to 10/25/50 because the median 30-min put-OI change at the wall is +46% (5% would filter nothing).
- Outcomes (spot, from the signal-minute close): +50/+100/+150 before −30/−50, within 30/60 min; a bar touching both counts as a loss; window capped at 15:14. Random benchmark: same signal minute on every other day of the same period (binomial vs that rate) and 2,000 random same-size draws. Fisher test vs the plain cross. BH across all variants×outcomes per side and period.
- Trades: nearest-weekly option, ATM or wall strike, fill = next minute’s open +3, exit −3 slippage, brokerage ₹20/order + STT/exchange/SEBI/stamp/GST (same as earlier sections). Exits: E1 spot stop K−20 / target +100; E2 spot stop K−30 / +150; E3 spot stop K−30, trail 40 behind once +50; E4 premium stop −20 + scale-out 40% at +20, 30% at +40, trail rest 20 (BE after +20); E5 spot stop K−30 + same scale-out; all 60-min cap. Lot size: 25 before 20-Nov-2024, 75 to Dec-2025, 65 in 2026. Rule = best mean net pts/trade on train with ≥30 trades among 440 combos per side (fixed 2026-10-26 16:39 IST; fixed_rule.json, full train grid).
Hit rates — calls (spot reaches +50 before −30 within 30 min)
| wall |
variant |
train n |
train hit% |
train random% |
test n |
test hit% |
test random% |
test plain-cross% |
p binom vs random |
p random draws |
p Fisher vs plain |
BH q |
test excl 23/26-Oct hit% |
| dyn |
a_plain |
153 |
26.8 |
20.1 |
106 |
16.0 |
19.3 |
16.0 |
0.461 |
0.240 |
– |
1.000 |
15.2 |
| dyn |
b_X1 |
63 |
23.8 |
16.9 |
52 |
17.3 |
17.2 |
16.0 |
1.000 |
0.538 |
0.823 |
1.000 |
15.7 |
| dyn |
b_X2 |
54 |
24.1 |
16.1 |
45 |
17.8 |
17.0 |
16.0 |
0.843 |
0.507 |
0.813 |
1.000 |
15.9 |
| dyn |
b_X3 |
48 |
20.8 |
15.7 |
37 |
16.2 |
16.7 |
16.0 |
1.000 |
0.562 |
1.000 |
1.000 |
13.9 |
| dyn |
c_X1_Y25 |
38 |
26.3 |
18.6 |
36 |
22.2 |
17.9 |
16.0 |
0.513 |
0.301 |
0.449 |
1.000 |
20.0 |
| dyn |
c_X2_Y10 |
43 |
20.9 |
16.4 |
39 |
17.9 |
17.4 |
16.0 |
0.835 |
0.532 |
0.803 |
1.000 |
15.8 |
| dyn |
c_X2_Y25 |
30 |
26.7 |
17.9 |
33 |
21.2 |
17.6 |
16.0 |
0.646 |
0.363 |
0.598 |
1.000 |
18.8 |
| dyn |
c_X2_Y50 |
15 |
40.0 |
20.1 |
24 |
20.8 |
18.4 |
16.0 |
0.791 |
0.440 |
0.556 |
1.000 |
20.8 |
| dyn |
d_X2_Y25_B3 |
13 |
30.8 |
17.0 |
12 |
0.0 |
14.8 |
16.0 |
0.235 |
0.149 |
0.211 |
1.000 |
0.0 |
| fixed |
a_plain |
31 |
19.4 |
19.8 |
25 |
20.0 |
18.6 |
20.0 |
0.799 |
0.512 |
– |
1.000 |
20.0 |
| fixed |
b_X1 |
16 |
12.5 |
16.7 |
16 |
31.2 |
16.7 |
20.0 |
0.168 |
0.108 |
0.472 |
1.000 |
31.2 |
| fixed |
b_X2 |
15 |
13.3 |
16.2 |
14 |
28.6 |
17.1 |
20.0 |
0.280 |
0.208 |
0.696 |
1.000 |
28.6 |
| fixed |
b_X3 |
14 |
7.1 |
15.9 |
10 |
30.0 |
17.5 |
20.0 |
0.394 |
0.232 |
0.661 |
1.000 |
30.0 |
| fixed |
c_X1_Y25 |
12 |
16.7 |
18.7 |
13 |
30.8 |
16.7 |
20.0 |
0.252 |
0.153 |
0.689 |
1.000 |
30.8 |
| fixed |
c_X2_Y10 |
14 |
14.3 |
16.5 |
13 |
23.1 |
17.0 |
20.0 |
0.473 |
0.390 |
1.000 |
1.000 |
23.1 |
| fixed |
c_X2_Y25 |
11 |
18.2 |
18.1 |
12 |
25.0 |
16.8 |
20.0 |
0.436 |
0.315 |
1.000 |
1.000 |
25.0 |
| fixed |
c_X2_Y50 |
7 |
28.6 |
19.8 |
8 |
37.5 |
18.7 |
20.0 |
0.175 |
0.195 |
0.366 |
1.000 |
37.5 |
| fixed |
d_X2_Y25_B3 |
7 |
14.3 |
17.0 |
5 |
0.0 |
15.0 |
20.0 |
1.000 |
0.427 |
0.556 |
1.000 |
0.0 |
Hit rates — calls (+100 before −30 within 60 min)
| wall |
variant |
train n |
train hit% |
train random% |
test n |
test hit% |
test random% |
test plain-cross% |
p binom vs random |
p random draws |
p Fisher vs plain |
BH q |
test excl 23/26-Oct hit% |
| dyn |
a_plain |
153 |
5.9 |
7.6 |
106 |
5.7 |
7.2 |
5.7 |
0.706 |
0.349 |
– |
1.000 |
4.8 |
| dyn |
b_X1 |
63 |
4.8 |
6.6 |
52 |
7.7 |
6.2 |
5.7 |
0.563 |
0.397 |
0.730 |
1.000 |
5.9 |
| dyn |
b_X2 |
54 |
5.6 |
6.3 |
45 |
8.9 |
6.2 |
5.7 |
0.357 |
0.303 |
0.486 |
1.000 |
6.8 |
| dyn |
b_X3 |
48 |
6.2 |
6.2 |
37 |
10.8 |
6.0 |
5.7 |
0.282 |
0.182 |
0.283 |
1.000 |
8.3 |
| dyn |
c_X1_Y25 |
38 |
2.6 |
7.1 |
36 |
5.6 |
6.8 |
5.7 |
1.000 |
0.565 |
1.000 |
1.000 |
2.9 |
| dyn |
c_X2_Y10 |
43 |
2.3 |
6.3 |
39 |
7.7 |
6.4 |
5.7 |
0.736 |
0.454 |
0.702 |
1.000 |
5.3 |
| dyn |
c_X2_Y25 |
30 |
3.3 |
6.8 |
33 |
6.1 |
6.7 |
5.7 |
1.000 |
0.639 |
1.000 |
1.000 |
3.1 |
| dyn |
c_X2_Y50 |
15 |
6.7 |
7.2 |
24 |
4.2 |
7.1 |
5.7 |
1.000 |
0.508 |
1.000 |
1.000 |
4.2 |
| dyn |
d_X2_Y25_B3 |
13 |
7.7 |
6.8 |
12 |
0.0 |
5.5 |
5.7 |
1.000 |
0.517 |
1.000 |
1.000 |
0.0 |
| fixed |
a_plain |
31 |
0.0 |
7.2 |
25 |
4.0 |
6.8 |
4.0 |
1.000 |
0.486 |
– |
1.000 |
4.0 |
| fixed |
b_X1 |
16 |
0.0 |
6.6 |
16 |
6.2 |
5.8 |
4.0 |
0.618 |
0.609 |
1.000 |
1.000 |
6.2 |
| fixed |
b_X2 |
15 |
0.0 |
6.4 |
14 |
7.1 |
6.0 |
4.0 |
0.582 |
0.574 |
1.000 |
1.000 |
7.1 |
| fixed |
b_X3 |
14 |
0.0 |
6.3 |
10 |
10.0 |
6.2 |
4.0 |
0.473 |
0.466 |
0.496 |
1.000 |
10.0 |
| fixed |
c_X1_Y25 |
12 |
0.0 |
7.1 |
13 |
0.0 |
6.0 |
4.0 |
1.000 |
0.446 |
1.000 |
1.000 |
0.0 |
| fixed |
c_X2_Y10 |
14 |
0.0 |
6.4 |
13 |
0.0 |
6.0 |
4.0 |
1.000 |
0.444 |
1.000 |
1.000 |
0.0 |
| fixed |
c_X2_Y25 |
11 |
0.0 |
6.9 |
12 |
0.0 |
6.0 |
4.0 |
1.000 |
0.482 |
1.000 |
1.000 |
0.0 |
| fixed |
c_X2_Y50 |
7 |
0.0 |
6.8 |
8 |
0.0 |
6.8 |
4.0 |
1.000 |
0.547 |
1.000 |
1.000 |
0.0 |
| fixed |
d_X2_Y25_B3 |
7 |
0.0 |
7.0 |
5 |
0.0 |
5.6 |
4.0 |
1.000 |
0.743 |
1.000 |
1.000 |
0.0 |
Hit rates — puts (spot falls 50 before rising 30, within 30 min)
| wall |
variant |
train n |
train hit% |
train random% |
test n |
test hit% |
test random% |
test plain-cross% |
p binom vs random |
p random draws |
p Fisher vs plain |
BH q |
test excl 23/26-Oct hit% |
| dyn |
a_plain |
234 |
31.2 |
22.6 |
170 |
20.6 |
21.6 |
20.6 |
0.852 |
0.423 |
– |
1.000 |
20.5 |
| dyn |
b_X1 |
96 |
26.0 |
18.6 |
81 |
19.8 |
18.6 |
20.6 |
0.775 |
0.438 |
1.000 |
1.000 |
20.0 |
| dyn |
b_X2 |
79 |
27.8 |
18.2 |
64 |
20.3 |
18.6 |
20.6 |
0.747 |
0.412 |
1.000 |
1.000 |
20.3 |
| dyn |
b_X3 |
71 |
25.4 |
18.7 |
56 |
21.4 |
19.0 |
20.6 |
0.611 |
0.373 |
1.000 |
1.000 |
21.4 |
| dyn |
c_X1_Y25 |
59 |
25.4 |
20.7 |
62 |
19.4 |
19.4 |
20.6 |
1.000 |
0.580 |
1.000 |
1.000 |
19.7 |
| dyn |
c_X2_Y10 |
61 |
27.9 |
19.1 |
58 |
19.0 |
18.9 |
20.6 |
1.000 |
0.573 |
0.852 |
1.000 |
19.0 |
| dyn |
c_X2_Y25 |
46 |
28.3 |
20.4 |
50 |
20.0 |
19.6 |
20.6 |
0.860 |
0.523 |
1.000 |
1.000 |
20.0 |
| dyn |
c_X2_Y50 |
29 |
27.6 |
22.4 |
36 |
25.0 |
20.2 |
20.6 |
0.532 |
0.290 |
0.654 |
1.000 |
25.0 |
| dyn |
d_X2_Y25_B3 |
16 |
18.8 |
20.3 |
9 |
0.0 |
16.6 |
20.6 |
0.372 |
0.174 |
0.209 |
1.000 |
0.0 |
| fixed |
a_plain |
53 |
22.6 |
23.7 |
49 |
18.4 |
20.9 |
18.4 |
0.860 |
0.412 |
– |
1.000 |
18.4 |
| fixed |
b_X1 |
27 |
11.1 |
21.0 |
30 |
16.7 |
18.5 |
18.4 |
1.000 |
0.501 |
1.000 |
1.000 |
16.7 |
| fixed |
b_X2 |
21 |
14.3 |
19.8 |
24 |
12.5 |
18.4 |
18.4 |
0.603 |
0.328 |
0.739 |
1.000 |
12.5 |
| fixed |
b_X3 |
21 |
14.3 |
19.8 |
23 |
13.0 |
18.7 |
18.4 |
0.603 |
0.361 |
0.740 |
1.000 |
13.0 |
| fixed |
c_X1_Y25 |
20 |
10.0 |
23.0 |
24 |
12.5 |
18.8 |
18.4 |
0.603 |
0.297 |
0.739 |
1.000 |
12.5 |
| fixed |
c_X2_Y10 |
20 |
15.0 |
19.2 |
23 |
8.7 |
18.5 |
18.4 |
0.291 |
0.168 |
0.484 |
1.000 |
8.7 |
| fixed |
c_X2_Y25 |
14 |
14.3 |
22.0 |
20 |
10.0 |
18.9 |
18.4 |
0.403 |
0.245 |
0.490 |
1.000 |
10.0 |
| fixed |
c_X2_Y50 |
9 |
22.2 |
23.0 |
14 |
14.3 |
19.5 |
18.4 |
1.000 |
0.468 |
1.000 |
1.000 |
14.3 |
| fixed |
d_X2_Y25_B3 |
8 |
0.0 |
21.8 |
4 |
0.0 |
14.5 |
18.4 |
1.000 |
0.525 |
1.000 |
1.000 |
0.0 |
Hit rates — puts (−100 before +30 within 60 min)
| wall |
variant |
train n |
train hit% |
train random% |
test n |
test hit% |
test random% |
test plain-cross% |
p binom vs random |
p random draws |
p Fisher vs plain |
BH q |
test excl 23/26-Oct hit% |
| dyn |
a_plain |
234 |
15.8 |
10.1 |
170 |
7.1 |
8.0 |
7.1 |
0.777 |
0.398 |
– |
1.000 |
7.2 |
| dyn |
b_X1 |
96 |
9.4 |
8.2 |
81 |
6.2 |
6.7 |
7.1 |
1.000 |
0.551 |
1.000 |
1.000 |
6.2 |
| dyn |
b_X2 |
79 |
10.1 |
7.9 |
64 |
7.8 |
6.7 |
7.1 |
0.618 |
0.439 |
0.785 |
1.000 |
7.8 |
| dyn |
b_X3 |
71 |
8.5 |
8.2 |
56 |
7.1 |
6.8 |
7.1 |
0.791 |
0.523 |
1.000 |
1.000 |
7.1 |
| dyn |
c_X1_Y25 |
59 |
6.8 |
9.2 |
62 |
6.5 |
7.0 |
7.1 |
1.000 |
0.562 |
1.000 |
1.000 |
6.6 |
| dyn |
c_X2_Y10 |
61 |
8.2 |
8.4 |
58 |
8.6 |
6.9 |
7.1 |
0.598 |
0.359 |
0.773 |
1.000 |
8.6 |
| dyn |
c_X2_Y25 |
46 |
8.7 |
9.0 |
50 |
8.0 |
7.1 |
7.1 |
0.780 |
0.477 |
0.763 |
1.000 |
8.0 |
| dyn |
c_X2_Y50 |
29 |
3.4 |
9.9 |
36 |
5.6 |
7.3 |
7.1 |
1.000 |
0.484 |
1.000 |
1.000 |
5.6 |
| dyn |
d_X2_Y25_B3 |
16 |
0.0 |
8.7 |
9 |
11.1 |
6.3 |
7.1 |
0.442 |
0.448 |
0.501 |
1.000 |
11.1 |
| fixed |
a_plain |
53 |
5.7 |
10.8 |
49 |
4.1 |
7.6 |
4.1 |
0.586 |
0.248 |
– |
1.000 |
4.1 |
| fixed |
b_X1 |
27 |
0.0 |
9.4 |
30 |
0.0 |
7.0 |
4.1 |
0.269 |
0.108 |
0.523 |
1.000 |
0.0 |
| fixed |
b_X2 |
21 |
0.0 |
8.8 |
24 |
0.0 |
7.0 |
4.1 |
0.410 |
0.173 |
1.000 |
1.000 |
0.0 |
| fixed |
b_X3 |
21 |
0.0 |
8.8 |
23 |
0.0 |
7.0 |
4.1 |
0.404 |
0.187 |
1.000 |
1.000 |
0.0 |
| fixed |
c_X1_Y25 |
20 |
0.0 |
10.4 |
24 |
0.0 |
7.2 |
4.1 |
0.413 |
0.182 |
1.000 |
1.000 |
0.0 |
| fixed |
c_X2_Y10 |
20 |
0.0 |
8.5 |
23 |
0.0 |
7.1 |
4.1 |
0.406 |
0.198 |
1.000 |
1.000 |
0.0 |
| fixed |
c_X2_Y25 |
14 |
0.0 |
9.8 |
20 |
0.0 |
7.3 |
4.1 |
0.395 |
0.219 |
1.000 |
1.000 |
0.0 |
| fixed |
c_X2_Y50 |
9 |
0.0 |
10.3 |
14 |
0.0 |
7.3 |
4.1 |
0.618 |
0.343 |
1.000 |
1.000 |
0.0 |
| fixed |
d_X2_Y25_B3 |
8 |
0.0 |
9.5 |
4 |
0.0 |
5.9 |
4.1 |
1.000 |
0.791 |
1.000 |
1.000 |
0.0 |
All 88 variants × 12 outcomes × 3 periods: hit_stats.csv. Five smallest 2026 p-values (none survive BH):
| side |
wall |
variant |
outcome |
n |
hits |
rate |
rand_rate |
p_binom |
q_bh |
| call |
dyn |
d_X1_Y25_B3 |
p50_s50_w60 |
13 |
0 |
0.0 |
26.962 |
0.026 |
1.0 |
| call |
dyn |
d_X3_Y25_B3 |
p50_s50_w60 |
14 |
0 |
0.0 |
26.643 |
0.028 |
1.0 |
| call |
dyn |
d_X2_Y25_B3 |
p50_s50_w60 |
12 |
0 |
0.0 |
26.208 |
0.045 |
1.0 |
| call |
dyn |
d_X1_Y25_B3 |
p50_s30_w60 |
13 |
0 |
0.0 |
23.192 |
0.049 |
1.0 |
| call |
dyn |
d_X3_Y25_B3 |
p50_s30_w60 |
14 |
0 |
0.0 |
23.179 |
0.051 |
1.0 |
Max favourable / adverse excursion in 60 min (spot pts)
| side |
wall |
variant |
split |
n |
mfe60_med |
mae60_med |
mfe60_mean |
mae60_mean |
| call |
dyn |
a_plain |
train |
153 |
37.2 |
30.1 |
47.8 |
44.2 |
| call |
dyn |
a_plain |
test |
106 |
35.8 |
37.6 |
46.6 |
48.2 |
| call |
dyn |
b_X2 |
train |
54 |
30.5 |
23.0 |
41.9 |
45.5 |
| call |
dyn |
b_X2 |
test |
45 |
32.5 |
30.5 |
40.5 |
42.7 |
| call |
dyn |
c_X2_Y25 |
train |
30 |
31.4 |
20.2 |
41.2 |
34.3 |
| call |
dyn |
c_X2_Y25 |
test |
33 |
32.5 |
26.9 |
42.3 |
40.9 |
| call |
dyn |
d_X2_Y25_B3 |
train |
13 |
42.2 |
13.8 |
50.4 |
30.0 |
| call |
dyn |
d_X2_Y25_B3 |
test |
12 |
26.9 |
29.1 |
25.2 |
44.2 |
| call |
fixed |
a_plain |
train |
31 |
29.7 |
30.1 |
36.1 |
42.3 |
| call |
fixed |
a_plain |
test |
25 |
26.6 |
39.9 |
36.8 |
43.7 |
| call |
fixed |
b_X2 |
train |
15 |
30.2 |
23.8 |
33.6 |
48.9 |
| call |
fixed |
b_X2 |
test |
14 |
35.0 |
14.0 |
40.7 |
31.5 |
| call |
fixed |
c_X2_Y25 |
train |
11 |
37.5 |
23.8 |
37.0 |
41.3 |
| call |
fixed |
c_X2_Y25 |
test |
12 |
35.0 |
14.0 |
37.2 |
30.3 |
| call |
fixed |
d_X2_Y25_B3 |
train |
7 |
41.4 |
11.5 |
38.8 |
43.5 |
| call |
fixed |
d_X2_Y25_B3 |
test |
5 |
29.2 |
8.6 |
24.5 |
26.9 |
| put |
dyn |
a_plain |
train |
234 |
41.1 |
34.5 |
59.7 |
44.1 |
| put |
dyn |
a_plain |
test |
170 |
36.3 |
36.6 |
47.0 |
52.7 |
| put |
dyn |
b_X2 |
train |
79 |
34.6 |
33.5 |
51.1 |
43.9 |
| put |
dyn |
b_X2 |
test |
64 |
29.8 |
42.4 |
43.5 |
53.7 |
| put |
dyn |
c_X2_Y25 |
train |
46 |
36.2 |
36.2 |
56.4 |
45.3 |
| put |
dyn |
c_X2_Y25 |
test |
50 |
29.8 |
36.8 |
43.5 |
54.5 |
| put |
dyn |
d_X2_Y25_B3 |
train |
16 |
33.3 |
43.0 |
48.6 |
55.1 |
| put |
dyn |
d_X2_Y25_B3 |
test |
9 |
26.7 |
50.3 |
34.8 |
77.4 |
| put |
fixed |
a_plain |
train |
53 |
36.2 |
36.6 |
46.3 |
44.9 |
| put |
fixed |
a_plain |
test |
49 |
30.5 |
39.9 |
37.3 |
51.5 |
| put |
fixed |
b_X2 |
train |
21 |
31.8 |
38.0 |
38.0 |
50.1 |
| put |
fixed |
b_X2 |
test |
24 |
29.8 |
27.7 |
35.6 |
49.1 |
| put |
fixed |
c_X2_Y25 |
train |
14 |
31.9 |
41.7 |
39.3 |
54.4 |
| put |
fixed |
c_X2_Y25 |
test |
20 |
29.8 |
37.3 |
33.4 |
53.9 |
| put |
fixed |
d_X2_Y25_B3 |
train |
8 |
27.5 |
62.5 |
33.7 |
73.3 |
| put |
fixed |
d_X2_Y25_B3 |
test |
4 |
20.6 |
118.0 |
21.2 |
142.6 |
Buyer trades after costs: fixed rules vs benchmarks
Call rule: dynamic wall, X=2% CE-OI drop within 3 min, PE OI ≥+25% in prior 30 min, buy wall-strike CE, exit E4_prem20_scale. Put rule: dynamic put wall, plain cross, buy wall-strike PE, exit E2_spotstopK30_t150.
| side |
what |
period |
n |
net pts/trade |
median |
win % |
₹/lot total |
₹/lot per trade |
test pts excl 23/26-Oct |
| call |
fixed rule |
train |
30 |
1.54 |
3.88 |
63.33 |
4721.85 |
157.40 |
– |
| call |
fixed rule |
test |
33 |
-9.57 |
-16.09 |
33.33 |
-20522.64 |
-621.90 |
-11.03 |
| call |
plain cross (a), same option+exit |
train |
153 |
-2.74 |
-1.36 |
49.02 |
-26056.63 |
-170.30 |
– |
| call |
plain cross (a), same option+exit |
test |
106 |
-8.68 |
-23.81 |
33.96 |
-59803.78 |
-564.19 |
-9.17 |
| call |
random same-minute entry (20× per trade) |
train |
600 |
-6.82 |
-16.09 |
39.83 |
-263531.45 |
-439.22 |
– |
| call |
random same-minute entry (20× per trade) |
test |
660 |
-9.07 |
-23.77 |
34.39 |
-389312.66 |
-589.87 |
-8.91 |
| put |
fixed rule |
train |
234 |
-3.95 |
-16.77 |
31.20 |
-73490.53 |
-314.06 |
– |
| put |
fixed rule |
test |
170 |
-9.36 |
-17.31 |
24.12 |
-103424.21 |
-608.38 |
-8.91 |
| put |
plain cross (a), same option+exit |
train |
234 |
-3.95 |
-16.77 |
31.20 |
-73490.53 |
-314.06 |
– |
| put |
plain cross (a), same option+exit |
test |
170 |
-9.36 |
-17.31 |
24.12 |
-103424.21 |
-608.38 |
-8.91 |
| put |
random same-minute entry (20× per trade) |
train |
4679 |
-7.41 |
-14.06 |
23.04 |
-2460739.23 |
-525.91 |
– |
| put |
random same-minute entry (20× per trade) |
test |
3400 |
-6.61 |
-13.03 |
25.29 |
-1460137.63 |
-429.45 |
-6.75 |
By year
| year |
n |
net pts/trade |
win % |
₹/lot total |
side |
| 2024 |
1 |
-24.97 |
0.00 |
-624.31 |
call |
| 2025 |
29 |
2.46 |
65.52 |
5346.16 |
call |
| 2026 |
33 |
-9.57 |
33.33 |
-20522.64 |
call |
| 2024 |
55 |
-0.48 |
30.91 |
-6132.85 |
put |
| 2025 |
179 |
-5.02 |
31.28 |
-67357.68 |
put |
| 2026 |
170 |
-9.36 |
24.12 |
-103424.21 |
put |
By month (n, net pts/trade, ₹/lot)
| month |
call mean_pts |
put mean_pts |
call n |
put n |
call rs_lot |
put rs_lot |
| 2024-10 |
-25.0 |
2.4 |
1.0 |
19.0 |
-624.3 |
1130.9 |
| 2024-11 |
– |
-5.4 |
– |
21.0 |
– |
-10422.4 |
| 2024-12 |
– |
2.8 |
– |
15.0 |
– |
3158.6 |
| 2025-01 |
21.8 |
-5.8 |
1.0 |
16.0 |
1632.6 |
-6965.2 |
| 2025-02 |
– |
-1.4 |
– |
18.0 |
– |
-1851.7 |
| 2025-03 |
9.8 |
0.3 |
4.0 |
8.0 |
2947.6 |
184.4 |
| 2025-04 |
-23.7 |
-3.6 |
3.0 |
19.0 |
-5329.4 |
-5111.1 |
| 2025-05 |
2.3 |
-10.3 |
2.0 |
19.0 |
338.5 |
-14652.7 |
| 2025-06 |
8.8 |
-16.3 |
5.0 |
8.0 |
3302.2 |
-9781.1 |
| 2025-07 |
12.4 |
2.5 |
3.0 |
18.0 |
2785.8 |
3384.5 |
| 2025-08 |
12.6 |
-8.2 |
1.0 |
19.0 |
942.8 |
-11638.9 |
| 2025-09 |
11.8 |
-0.1 |
2.0 |
14.0 |
1774.2 |
-74.3 |
| 2025-10 |
-9.8 |
1.7 |
5.0 |
15.0 |
-3686.4 |
1886.8 |
| 2025-11 |
16.2 |
-21.3 |
2.0 |
10.0 |
2425.8 |
-15953.0 |
| 2025-12 |
-23.8 |
-6.0 |
1.0 |
15.0 |
-1787.6 |
-6785.3 |
| 2026-01 |
7.0 |
-10.9 |
2.0 |
21.0 |
907.6 |
-14932.6 |
| 2026-02 |
-14.7 |
-8.3 |
3.0 |
20.0 |
-2872.1 |
-10749.7 |
| 2026-03 |
-10.3 |
-5.8 |
2.0 |
18.0 |
-1336.8 |
-6756.5 |
| 2026-04 |
-23.9 |
-10.8 |
4.0 |
19.0 |
-6206.2 |
-13399.6 |
| 2026-05 |
1.6 |
-21.9 |
3.0 |
14.0 |
313.2 |
-19924.7 |
| 2026-06 |
-9.7 |
4.4 |
5.0 |
15.0 |
-3165.2 |
4319.5 |
| 2026-07 |
-10.9 |
-14.9 |
3.0 |
13.0 |
-2118.8 |
-12624.7 |
| 2026-08 |
-10.8 |
-10.6 |
2.0 |
18.0 |
-1404.3 |
-12405.6 |
| 2026-09 |
-14.7 |
-0.5 |
3.0 |
16.0 |
-2861.2 |
-526.4 |
| 2026-10 |
-4.6 |
-15.8 |
6.0 |
16.0 |
-1778.9 |
-16423.8 |
Expiry-day / pre-expiry (gamma) and Mon/Tue
Weekly Nifty expiry was Thursday until Aug-2025, Tuesday from Sep-2025, so “Mon/Tue” = pre-expiry/expiry only for the recent period; the gamma buckets use trading days to expiry.
| side |
period |
gamma |
n |
pts |
win |
rs_lot |
| call |
test |
expiry day |
10 |
-12.95 |
30.00 |
-8418.63 |
| call |
test |
other |
16 |
-7.03 |
31.25 |
-7308.78 |
| call |
test |
pre-expiry |
7 |
-10.54 |
42.86 |
-4795.23 |
| call |
train |
expiry day |
13 |
-4.77 |
46.15 |
-3403.46 |
| call |
train |
other |
12 |
7.43 |
75.00 |
6690.27 |
| call |
train |
pre-expiry |
5 |
3.83 |
80.00 |
1435.04 |
| put |
test |
expiry day |
34 |
-8.33 |
23.53 |
-18416.16 |
| put |
test |
other |
98 |
-8.96 |
23.47 |
-57067.51 |
| put |
test |
pre-expiry |
38 |
-11.31 |
26.32 |
-27940.54 |
| put |
train |
expiry day |
56 |
-3.02 |
35.71 |
-17510.14 |
| put |
train |
other |
133 |
-3.55 |
31.58 |
-38709.37 |
| put |
train |
pre-expiry |
45 |
-6.29 |
24.44 |
-17271.02 |
| side |
period |
MonTue |
n |
pts |
win |
| call |
test |
Mon/Tue |
16 |
-9.12 |
37.50 |
| call |
test |
Wed–Fri |
17 |
-9.99 |
29.41 |
| call |
train |
Mon/Tue |
7 |
1.96 |
71.43 |
| call |
train |
Wed–Fri |
23 |
1.42 |
60.87 |
| put |
test |
Mon/Tue |
67 |
-10.36 |
25.37 |
| put |
test |
Wed–Fri |
103 |
-8.71 |
23.30 |
| put |
train |
Mon/Tue |
93 |
-5.43 |
27.96 |
| put |
train |
Wed–Fri |
141 |
-2.97 |
33.33 |
Worst days (₹/lot) and worst single trades
| side |
date |
pnl_rs_lot |
| put |
Mon 07-Apr-2025 |
-8558.0 |
| put |
Fri 06-Jun-2025 |
-5551.0 |
| put |
Fri 07-Feb-2025 |
-4863.0 |
| call |
Fri 05-Dec-2025 |
-1788.0 |
| call |
Fri 03-Oct-2025 |
-1785.0 |
| call |
Tue 28-Oct-2025 |
-1784.0 |
| side |
date |
hm_sig |
K |
fill |
pnl |
pnl_rs_lot |
| put |
07-Apr-2025 |
09:17 |
22000.0 |
340.8 |
-114.1 |
-8557.7 |
| call |
10-Oct-2024 |
10:06 |
25100.0 |
62.8 |
-25.0 |
-624.3 |
Today, 26-Oct-2026
| side |
wall |
strike |
cross |
stage |
signal |
own-OI chg 1/2/3 min % |
opposite OI 30m % |
basis chg 5m |
+50 before −30 (30m) |
+100 before −30 (60m) |
MFE60 |
MAE60 |
wall opt fill |
net pts E4 (prem stop+scale) |
net pts E2 (spot K−30, +150) |
| call |
dyn |
22500 |
09:52 |
(a) plain cross |
09:52 |
-8.5 / -12.2 / -17.0 |
28.8 |
-13.1 |
1.0 |
1.0 |
201.0 |
1.9 |
164.2 |
42.4 |
102.9 |
| call |
dyn |
22500 |
09:52 |
(b) OI drop ≥1% |
09:53 |
-8.5 / -12.2 / -17.0 |
28.8 |
2.0 |
1.0 |
1.0 |
176.1 |
1.4 |
181.8 |
37.1 |
127.6 |
| put |
dyn |
22500 |
09:17 |
(a) plain cross |
09:17 |
10.9 / 9.0 / 7.7 |
22.6 |
– |
1.0 |
0.0 |
75.9 |
242.9 |
127.1 |
3.7 |
-44.9 |
| put |
dyn |
22500 |
09:17 |
(b) OI drop ≥1% |
did not fire |
10.9 / 9.0 / 7.7 |
22.6 |
– |
– |
– |
– |
– |
– |
– |
– |
| put |
dyn |
22400 |
09:25 |
(a) plain cross |
09:25 |
10.4 / 12.0 / 12.0 |
114.3 |
4.8 |
0.0 |
0.0 |
0.9 |
317.9 |
119.4 |
-23.9 |
-27.2 |
| put |
dyn |
22400 |
09:25 |
(b) OI drop ≥1% |
did not fire |
10.4 / 12.0 / 12.0 |
114.3 |
– |
– |
– |
– |
– |
– |
– |
– |
Identical rows for X=1/2/3 collapsed (all fired at 09:53). (c) with Y=10/25 fired today (put-OI +28.8%); Y=50 and (d) did not. Fixed 09:20 call wall today was not crossed.
Data gaps and caveats
- Spot 15:15–15:29 frozen since 03-Aug-2026 → treated as missing; all outcome windows capped at 15:14 for every year. Option/futures bars after 15:29 not used. Nothing filled.
- Days without a usable option panel: 2024-12-20, 2024-12-23, 2024-12-24, 2024-12-26 (expiry-26-Dec-2024 file has strikes far from spot) — excluded. Today’s options: Upstox intraday, strikes 21,800–23,200 (enough for ±300).
- OI granularity: the 1-min OI series updates every 3 minutes until 08-May-2026 and roughly every minute from 11-May-2026, so the “1–3 minute” drop window always contains exactly one OI print in train. This blurs X=1/2/3 into nearly the same event, and makes the test period structurally different (finer OI). Not adjustable without filling.
- Small samples: call rule 30 train / 33 test trades; fixed-wall variants ≤31 per period. Hypothesis taken from today’s case (and 23-Oct), so 23/26-Oct-excluded test columns are shown.
- Costs approximate retail; real slippage in fast minutes can exceed 3 pts. The test is on spot paths; the trades use real 1-min option bars (next-minute open fill).
Files: callwall/results/ (events, hit_stats, excursions, train_grid, fixed_rule.json, rule_trades, rule_breakdowns, rule_vs_bench) · callwall/scripts/.