R0713: WATCH
Rule: When gap measured in the direction of the move so far ≤ -0.16% (≈-39 pts at 25,000) AND price vs prior-day low ≤ +0.37% (≈+94 pts at 25,000) at 11:00
Target: price reaches the prior-day low after 11:00 (days not yet at PDL) · Decision time: 11:00 IST (uses bars up to 11:00 only) · Method: subgroup · Family: level / structure
Verdict criteria
- ✔ Out-of-sample lift in the same direction as train
- ✔ OOS Wilson 95% CI excludes the OOS base rate
- ✔ OOS BH q ≤ 0.05 across all candidates tested OOS AND within its target family
- ✔ Train BH q ≤ 0.05 (across all hypotheses searched)
- ✔ Stable by year (same direction in ≥80% of years with ≥10 days, incl. every OOS year with ≥10)
- ✔ OOS matched-random placebo p ≤ 0.05
- ✘ OOS sample ≥ 20 days
Train p 6.2e-10; train BH q 1.6e-07; train Holm 0.006 (corrections over all 9,242,869 hypotheses); whole-pipeline shuffled-label placebo family-wise p 0.010 (100 permutations). Extra conditions beat the best single condition OOS: True.
By year
| year | rule days | hit | base (all days) | lift |
|---|---|---|---|---|
| 2022 | 11 | 73% | 19% | 3.81 |
| 2023 | 13 | 62% | 20% | 3.06 |
| 2024 | 8 | 75% | 14% | 5.46 |
| 2025 (OOS) | 12 | 58% | 15% | 3.93 |
| 2026 (OOS) | 7 | 57% | 16% | 3.46 |
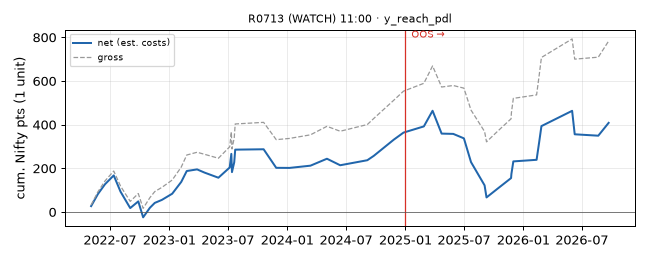
Spot-points backtest (estimated costs)
enter short at 11:00 price, take profit at PDL; stop 0.4% of entry; exit at close. Costs: Nifty futures round-trip model from nifty-setups-backtest/src/costs.py (brokerage, exchange, SEBI, stamp, GST, STT by date: 0.0125% → 0.02% from Oct-2024 → 0.05% from Apr-2026) + 0.5 pt slippage per side; spot used as a futures proxy (basis ignored); stop-first on ambiguous bars.
| window | trades | win rate | avg net pts | avg gross pts | total net | max DD pts | PF |
|---|---|---|---|---|---|---|---|
| train 2022–24 (in-sample) | 32 | 72% | +11.4 | +17.3 | +364.0 | +192.0 | +1.8 |
| OOS 2025–26 | 19 | 58% | +2.3 | +12.1 | +44.6 | +397.0 | +1.1 |
trades.csv · Generated 2026-10-10 00:44 IST.