Are our backtests biased against option buying? Audit, fixes and a clean re-run
Built 2026-10-26 18:10 IST. Research only, not advice. Read-only data, no orders. Asked 26-Oct-2026 17:11 IST: “you are not able to find 1 strategy in option buying which is profitable, you are doing something wrong, there are thousands of strategies and you say all of them lose.”
Update 26-Oct-2026 (asked 18:06 IST): “trail the profit at 50% after 1:2” re-run → section 6. It does not change the verdict.
Short answer.
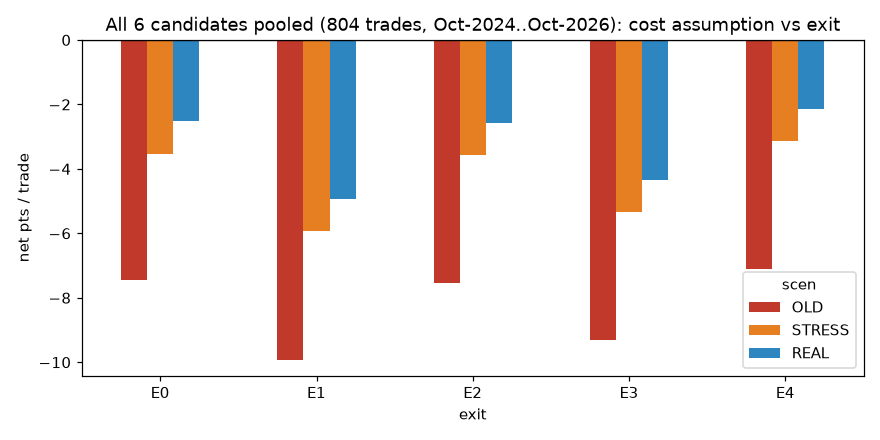
- Yes, we got one big thing wrong: costs. Earlier pages (recoveries, lows, call-wall, pre-expiry, last-30, overnight) charged 3 pts slippage per side on ATM weekly options. The real Upstox order book (31,096 snapshots, 11 sessions, Oct-2026) shows a median ATM/±1 bid-ask spread of 0.25 pt (90th percentile 0.40). Top-of-book size is about 9–10 lots. A realistic fill is ≈0.5 pt per side. That is about 2.0 pts (≈₹133/lot of 65) per 2-order round trip including all charges, not ≈7. Fixing it improves every result by ≈+4.9 pts/trade. The famous “random entries lose −9” falls to about −2.5.
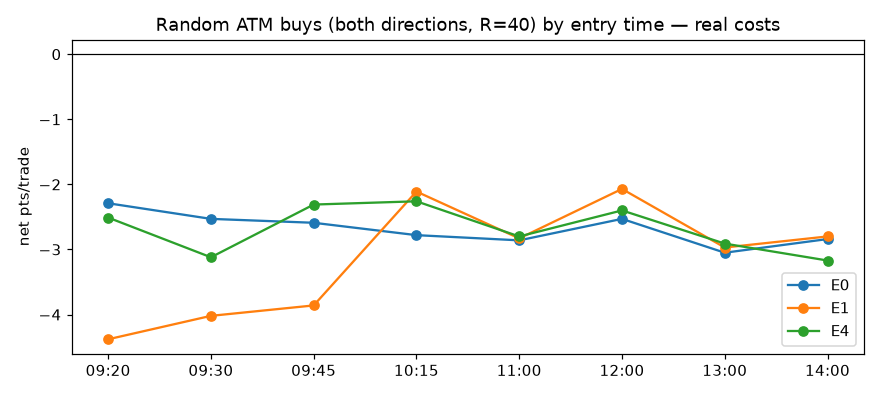
- The other suspected flaws were checked and are small. Buyer-style exits (structural spot stop, no scale-out, hold to 15:14, 2R/4R targets, ATR-like trail) do not beat the old scale-out on average. Pooled across 804 trades: trail E4 -2.13, old E0 -2.52, 2R -2.57, 4R -4.33, hold-to-close -4.94 pts. With-trend beats counter-trend by only ≈0.2–0.7 pt. First-hour entries are no cheaper than mid-day. Strike choice (ITM/ATM/OTM) moves results by ±1 pt. No lookahead was found in the old code.
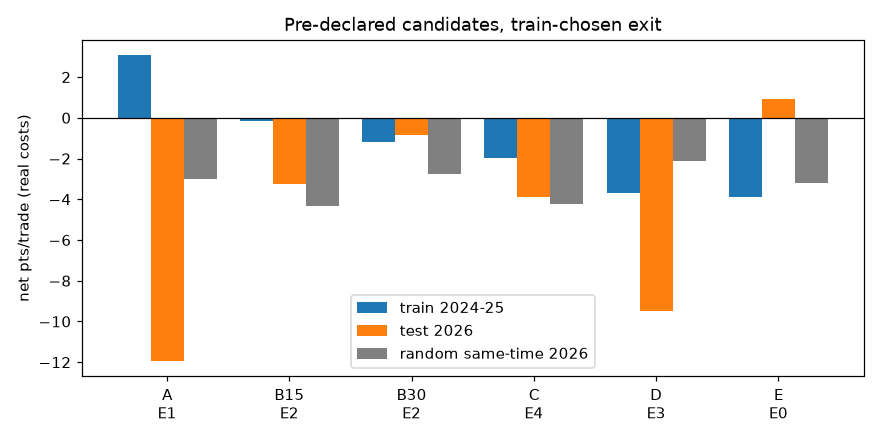
- Even after the fixes, none of the 6 pre-declared candidates is profitable out of sample. In 2026, 5 of 6 are negative. The trend-day filter is +0.93 pts/trade (n=28, p=0.41, BH q=1). None survives BH. Most sit at or below random same-time entries with the same exits.
- Where the edge really is: ORB with-gap plus a structural stop held to 15:14 makes +5.9 (ORB15) / +8.1 (ORB30) Nifty points per trade on spot, 2022–2026, positive in every year (ORB30 p=0.04 before multiple-testing correction). The option buyer keeps only ≈25–50% of that move. Theta and the intraday IV drift eat the rest, then about 2 pts of cost, so the trades end at −1 to −5 pts. The problem is not that we test the wrong patterns. Intraday spot edges of 5–10 points are smaller than what a long option bleeds over the hours needed to collect them.
- A lead, not a strategy (found after looking at 2026, so it is post-hoc): the put side of ORB with-gap (gap-down day, breaks the opening range down, 2–6 strikes ITM, structural stop, hold to 15:14) made +5.6 to +7.4 pts/trade in 2026 (n≈50) but about 0 in 2024–25 (−3.5 to +2.6). It goes on a forward-watch list, not a trade list.
1. What we were doing wrong (measured)
| # | Suspected flaw | Evidence in our code | Verdict | Measured impact |
|---|
| 1 | Slippage 3 pts/side | SLIP=3.0 in recov/tradelib.py, lows/part2_options.py, callwall/cwlib.py, pre-expiry/backtest_pre.py, last30/options_pnl.py, overnight/backtest.py. (nifty-setups-backtest used 0.3–0.5, which is fine.) | CONFIRMED, the main flaw | OLD→REAL: E0 -7.45→-2.52; E1 -9.92→-4.94 pts/trade, i.e. +4.9 pts/trade (≈₹320/lot). Stress at 1 pt/side costs another −1.0. |
| 1b | STT | Old code used 0.10% on all sells. It has been 0.15% since 1-Apr-2026 (Finance Act 2026, NSE circular). | Confirmed, tiny | ≈−0.07 pt/trade in 2026 (it made old 2026 results slightly too good) |
| 2 | Premium stop −20 + scale-out cut the right tail | E0 in tradelib/cwlib: stop −20, 40% at +20, 30% at +40, 60-min cap | Not confirmed | Pooled REAL: E0 -2.52 vs structural stop + hold to 15:14 -4.94, 4R -4.33, 2R -2.57, trail -2.13. Longer holds raise the payoff ratio (1.4–2.7) but win rates drop to 20–35% and theta is paid for longer. Only the trail is better, by ≈+0.4. |
| 3 | Entries were countertrend or late; first hour ignored | recov and lows were rebound fades. callwall was a mid-day cross. | Partly true, small | Random entries: with-trend -2.69 vs counter -2.91 (first hour -2.49 vs -3.19). First-hour random entries -3.07 vs later -2.69, so no free first-hour edge. All 6 candidates here are with-trend and first-hour. |
| 4a | Lookahead / same-bar entry | All old option sims fill at the next minute's open. Stops fill at min(open, stop). | Not found | 0. One small optimism: recov 'spotstop' exits at the same bar's close. |
| 4b | Wrong strike | ATM only in recov/callwall | Minor | ITM1/ITM2/OTM1 vs ATM: −0.1 to +0.6 pt on average. 0DTE is worse (−0.5 to −1.1). |
| 4c | Spot close vs executable option price | Old trades already used real 1-min option bars | Not a flaw | – |
| 4d | Too many variants / BH kills everything | callwall picked 1 of 440 combos per side. Last30 had dozens of variants. | Real issue (it cuts both ways) | Here the family is fixed at 6 tests, declared before 2026 was opened. Nothing is positive enough for BH to even matter: the best raw p is 0.41. |
| 4e | 60-min hold cap | recov/callwall used 60 min (runner 240) | Tested via E1–E4 (hold to 15:14) | Holding longer did not help on average (see #2) |
| 4f | Sessions excluded / missing data | Spot 15:15–15:29 frozen since 2026-08-03 is treated as missing. Options are real to 15:40. | Handled | The time exit is at the 15:15 option open, so the frozen window is never used. |
2. Corrected cost per trade
Bid-ask from the Upstox ATM-feed snapshots (strikes ATM±2, CE+PE, 08–26 Oct 2026). Spread in option points:
| tod |
n |
mean |
median |
p90 |
half_spread_med |
| 09:15-19 |
108 |
0.294 |
0.300 |
0.450 |
0.150 |
| 09:20-29 |
180 |
0.284 |
0.300 |
0.400 |
0.150 |
| 09:30-10:14 |
1350 |
0.257 |
0.250 |
0.400 |
0.125 |
| 10:15-13:59 |
11724 |
0.262 |
0.250 |
0.400 |
0.125 |
| 14:00-15:14 |
4470 |
0.242 |
0.250 |
0.400 |
0.125 |
| 15:15+ |
825 |
0.231 |
0.250 |
0.400 |
0.125 |
| dte |
n |
mean |
median |
p90 |
| 0 |
3993 |
0.131 |
0.100 |
0.200 |
| 1 |
3618 |
0.236 |
0.225 |
0.350 |
| 3 |
330 |
0.257 |
0.250 |
0.350 |
| 4 |
3300 |
0.263 |
0.250 |
0.350 |
| 5 |
5700 |
0.319 |
0.300 |
0.450 |
| 6 |
1716 |
0.364 |
0.350 |
0.500 |
| offset |
n |
mean |
median |
p90 |
| -2 |
6220 |
0.293 |
0.250 |
0.500 |
| -1 |
6219 |
0.266 |
0.250 |
0.450 |
| 0 |
6219 |
0.251 |
0.250 |
0.400 |
| 1 |
6219 |
0.251 |
0.250 |
0.400 |
| 2 |
6219 |
0.272 |
0.250 |
0.450 |
Charges (2-order round trip, ATM premium ≈145, lot 65): brokerage ₹40, STT 0.15% of sell premium ≈₹14, NSE txn 0.03503% ≈₹7, GST 18% on brokerage+txn ≈₹8.5, SEBI and stamp <₹1. Total ≈₹68 = 1.04 pts. Scale-out exits use 3–4 orders: 1.43–1.96 pts.
Slippage: 0.5 pt/side used as REAL, against a measured half-spread of ≈0.13. That leaves room for a tick and for faster minutes. Stress case 1.0 pt/side.
Total REAL ≈ 2.0 pts/trade (₹133/lot) versus the old ≈7.0–8.0. Caveat: the spreads come from calm-to-normal Oct-2026 sessions. Gap opens and news minutes can be wider.
3. Re-run: 6 pre-declared candidates (PREREG.md, choices frozen in frozen_choices.json at 2026-10-26 17:22 IST before any 2026 number)
Instrument: ATM, nearest weekly with DTE≥1, CE for long / PE for short. Entry at the next minute's option open after a spot-bar-close signal. Exits are decided on spot and executed at the next option open. Time exit at the 15:15 option open. R = structural stop distance clipped to 15–70 spot pts. Exit set E0 legacy / E1 structural stop + time / E2 2R / E3 4R / E4 BE at 1R then trail 1R. The exit is chosen per candidate on TRAIN (Oct-2024..Dec-2025), then tested once on 2026 (to 23-Oct). REAL cost. Random = same-time, same-direction, same-R entries on random days of the same period with the same exit; percentile = rank of the candidate mean among 2,000 random same-size sets. ₹ per lot uses lot 75 in 2024–25 and 65 in 2026.
| cand |
name |
ex |
split |
n |
mean |
median |
win |
avg_win |
avg_loss |
payoff |
rs_per_trade |
rs_total |
maxdd_rs |
worst_month |
worst_month_rs |
random_mean |
random_pctile |
t_p_one |
q_bh |
| A |
O30 >150 continuation |
E1 |
train |
17 |
3.07 |
-25.50 |
29.41 |
97.91 |
-36.45 |
2.69 |
230.26 |
3,914.39 |
-23,448.74 |
2025-04 |
-9,860.44 |
-5.66 |
79.60 |
0.44 |
– |
| A |
O30 >150 continuation |
E1 |
test |
9 |
-11.93 |
-29.75 |
22.22 |
62.59 |
-33.23 |
1.88 |
-775.73 |
-6,981.56 |
-15,118.79 |
2026-03 |
-3,346.15 |
-3.01 |
34.85 |
0.76 |
1.00 |
| B15 |
ORB15 with-gap |
E2 |
train |
133 |
-0.13 |
-15.29 |
40.60 |
42.25 |
-29.10 |
1.45 |
-10.05 |
-1,336.65 |
-25,211.85 |
2024-11 |
-14,230.38 |
-2.99 |
80.90 |
0.52 |
– |
| B15 |
ORB15 with-gap |
E2 |
test |
99 |
-3.25 |
-19.85 |
29.29 |
55.51 |
-27.59 |
2.01 |
-210.92 |
-20,881.33 |
-51,903.72 |
2026-05 |
-22,166.98 |
-4.31 |
59.95 |
0.78 |
1.00 |
| B30 |
ORB30 with-gap |
E2 |
train |
124 |
-1.18 |
-14.26 |
39.52 |
43.50 |
-30.37 |
1.43 |
-88.47 |
-10,970.85 |
-29,207.01 |
2024-11 |
-13,852.35 |
-2.17 |
62.25 |
0.62 |
– |
| B30 |
ORB30 with-gap |
E2 |
test |
96 |
-0.87 |
-18.04 |
32.29 |
56.26 |
-28.11 |
2.00 |
-56.34 |
-5,408.30 |
-49,342.77 |
2026-05 |
-16,037.32 |
-2.78 |
69.10 |
0.58 |
1.00 |
| C |
Rule B early-low rebound (CE) |
E4 |
train |
56 |
-1.97 |
-14.26 |
33.93 |
44.72 |
-25.94 |
1.72 |
-147.47 |
-8,258.33 |
-24,044.11 |
2025-04 |
-17,015.99 |
-2.86 |
55.15 |
0.60 |
– |
| C |
Rule B early-low rebound (CE) |
E4 |
test |
57 |
-3.90 |
-9.77 |
38.60 |
25.50 |
-22.38 |
1.14 |
-253.38 |
-14,442.78 |
-21,655.55 |
2026-03 |
-7,891.55 |
-4.24 |
59.45 |
0.84 |
1.00 |
| D |
First-hour VWAP pullback |
E3 |
train |
88 |
-3.68 |
-12.35 |
22.73 |
41.61 |
-17.00 |
2.45 |
-275.90 |
-24,279.48 |
-46,854.24 |
2025-05 |
-11,671.27 |
-2.02 |
29.95 |
0.88 |
– |
| D |
First-hour VWAP pullback |
E3 |
test |
57 |
-9.47 |
-13.51 |
19.30 |
31.62 |
-19.30 |
1.64 |
-615.63 |
-35,090.99 |
-39,340.72 |
2026-01 |
-13,295.99 |
-2.11 |
1.30 |
1.00 |
1.00 |
| E |
Trend-day filter |
E0 |
train |
40 |
-3.90 |
-6.53 |
42.50 |
15.87 |
-18.51 |
0.86 |
-292.19 |
-11,687.46 |
-19,634.85 |
2025-04 |
-4,249.78 |
-0.13 |
11.55 |
0.89 |
– |
| E |
Trend-day filter |
E0 |
test |
28 |
0.93 |
5.90 |
60.71 |
14.02 |
-19.29 |
0.73 |
60.65 |
1,698.25 |
-5,163.77 |
2026-06 |
-2,343.53 |
-3.21 |
89.35 |
0.41 |
1.00 |
Per year (chosen exit, REAL cost)
| cand |
year |
n |
mean |
win |
rs |
| A |
2024 |
5 |
-28.8 |
20.0 |
-10,815.1 |
| A |
2025 |
12 |
16.4 |
33.3 |
14,729.5 |
| A |
2026 |
9 |
-11.9 |
22.2 |
-6,981.6 |
| B15 |
2024 |
22 |
-9.1 |
31.8 |
-14,977.2 |
| B15 |
2025 |
111 |
1.6 |
42.3 |
13,640.6 |
| B15 |
2026 |
99 |
-3.2 |
29.3 |
-20,881.3 |
| B30 |
2024 |
20 |
-5.6 |
35.0 |
-8,397.0 |
| B30 |
2025 |
104 |
-0.3 |
40.4 |
-2,573.9 |
| B30 |
2026 |
96 |
-0.9 |
32.3 |
-5,408.3 |
| C |
2024 |
20 |
-3.1 |
40.0 |
-4,641.0 |
| C |
2025 |
36 |
-1.3 |
30.6 |
-3,617.4 |
| C |
2026 |
57 |
-3.9 |
38.6 |
-14,442.8 |
| D |
2024 |
6 |
31.7 |
50.0 |
14,267.6 |
| D |
2025 |
82 |
-6.3 |
20.7 |
-38,547.0 |
| D |
2026 |
57 |
-9.5 |
19.3 |
-35,091.0 |
| E |
2024 |
6 |
-1.8 |
50.0 |
-817.7 |
| E |
2025 |
34 |
-4.3 |
41.2 |
-10,869.8 |
| E |
2026 |
28 |
0.9 |
60.7 |
1,698.3 |
per-month CSV
Secondary: every exit, REAL cost (exploratory, not in the family)
| cand |
ex |
mean_test |
mean_train |
n_test |
n_train |
| A |
E0 |
-9.66 |
-1.68 |
9.00 |
17.00 |
| A |
E1 |
-11.93 |
3.07 |
9.00 |
17.00 |
| A |
E2 |
-4.01 |
-9.12 |
9.00 |
17.00 |
| A |
E3 |
-11.93 |
-4.69 |
9.00 |
17.00 |
| A |
E4 |
-7.14 |
-0.62 |
9.00 |
17.00 |
| B15 |
E0 |
-1.04 |
-0.51 |
99.00 |
133.00 |
| B15 |
E1 |
-2.24 |
-3.69 |
99.00 |
133.00 |
| B15 |
E2 |
-3.24 |
-0.13 |
99.00 |
133.00 |
| B15 |
E3 |
-2.18 |
-3.66 |
99.00 |
133.00 |
| B15 |
E4 |
-1.03 |
-1.48 |
99.00 |
133.00 |
| B30 |
E0 |
-4.07 |
-1.81 |
96.00 |
124.00 |
| B30 |
E1 |
-4.62 |
-4.39 |
96.00 |
124.00 |
| B30 |
E2 |
-0.87 |
-1.18 |
96.00 |
124.00 |
| B30 |
E3 |
-3.44 |
-4.20 |
96.00 |
124.00 |
| B30 |
E4 |
-1.56 |
-2.99 |
96.00 |
124.00 |
| C |
E0 |
-0.72 |
-5.49 |
57.00 |
56.00 |
| C |
E1 |
-4.92 |
-11.43 |
57.00 |
56.00 |
| C |
E2 |
-0.42 |
-7.84 |
57.00 |
56.00 |
| C |
E3 |
-1.90 |
-8.06 |
57.00 |
56.00 |
| C |
E4 |
-3.90 |
-1.97 |
57.00 |
56.00 |
| D |
E0 |
-5.16 |
-3.99 |
57.00 |
88.00 |
| D |
E1 |
-7.81 |
-3.87 |
57.00 |
88.00 |
| D |
E2 |
-4.78 |
-5.70 |
57.00 |
88.00 |
| D |
E3 |
-9.47 |
-3.68 |
57.00 |
88.00 |
| D |
E4 |
-5.02 |
-3.70 |
57.00 |
88.00 |
| E |
E0 |
0.93 |
-3.90 |
28.00 |
40.00 |
| E |
E1 |
6.17 |
-17.13 |
28.00 |
40.00 |
| E |
E2 |
9.86 |
-8.71 |
28.00 |
40.00 |
| E |
E3 |
13.05 |
-17.13 |
28.00 |
40.00 |
| E |
E4 |
18.38 |
-9.80 |
28.00 |
40.00 |
The trend-day filter (E) with the trail E4 is +18.4 pts in 2026, but −9.8 in train. It was the worst-ranked choice on train, so taking it now would be fitting to 2026. Not claimed.
4. Why buyers still lose: the spot edge exists, the option eats it
Spot-only proxy (index points, no costs, same signal and exit; 2022–23 has no futures volume, so VWAP-based D/E start in Oct-2024):
| cand |
ex |
2022 |
2023 |
2024 |
2025 |
2026 |
| A |
E1 |
-56.9 |
-30.0 |
-44.4 |
27.2 |
-15.5 |
| A |
E4 |
-15.4 |
0.1 |
-22.8 |
9.9 |
-10.4 |
| B15 |
E1 |
4.5 |
4.0 |
8.7 |
8.2 |
4.3 |
| B15 |
E4 |
1.2 |
-0.6 |
4.5 |
6.2 |
3.4 |
| B30 |
E1 |
13.2 |
5.1 |
11.8 |
7.6 |
3.0 |
| B30 |
E4 |
11.8 |
0.5 |
12.3 |
6.3 |
5.0 |
| C |
E1 |
– |
– |
3.9 |
-4.3 |
0.8 |
| C |
E4 |
– |
– |
-1.3 |
11.2 |
-2.0 |
| D |
E1 |
– |
– |
40.2 |
-0.6 |
-0.8 |
| D |
E4 |
– |
– |
14.6 |
-3.4 |
-2.3 |
| E |
E1 |
– |
– |
-10.2 |
-17.2 |
16.9 |
| E |
E4 |
– |
– |
-5.9 |
-8.9 |
34.6 |
ORB with-gap held to 15:14 (E1): spot points vs what the option buyer keeps after REAL cost, by strikes ITM:
| cand |
itm |
scen |
split |
n |
spot_pts |
opt_gross |
pnl |
| B15 |
0 |
REAL |
test |
99 |
4.96 |
-1.19 |
-2.24 |
| B15 |
0 |
REAL |
train |
133 |
4.01 |
-2.73 |
-3.69 |
| B15 |
2 |
REAL |
test |
99 |
4.96 |
-1.57 |
-2.75 |
| B15 |
2 |
REAL |
train |
134 |
4.86 |
-1.48 |
-2.54 |
| B15 |
4 |
REAL |
test |
99 |
4.96 |
-1.73 |
-3.05 |
| B15 |
4 |
REAL |
train |
133 |
3.90 |
-1.65 |
-2.85 |
| B15 |
6 |
REAL |
test |
99 |
4.96 |
-1.38 |
-2.88 |
| B15 |
6 |
REAL |
train |
134 |
4.86 |
-0.30 |
-1.64 |
| B30 |
0 |
REAL |
test |
96 |
2.95 |
-3.58 |
-4.62 |
| B30 |
0 |
REAL |
train |
124 |
4.29 |
-3.43 |
-4.39 |
| B30 |
2 |
REAL |
test |
96 |
2.95 |
-4.01 |
-5.18 |
| B30 |
2 |
REAL |
train |
125 |
5.20 |
-2.27 |
-3.33 |
| B30 |
4 |
REAL |
test |
96 |
2.95 |
-4.02 |
-5.34 |
| B30 |
4 |
REAL |
train |
125 |
5.20 |
-1.36 |
-2.55 |
| B30 |
6 |
REAL |
test |
96 |
2.95 |
-3.79 |
-5.28 |
| B30 |
6 |
REAL |
train |
125 |
5.20 |
-1.21 |
-2.56 |
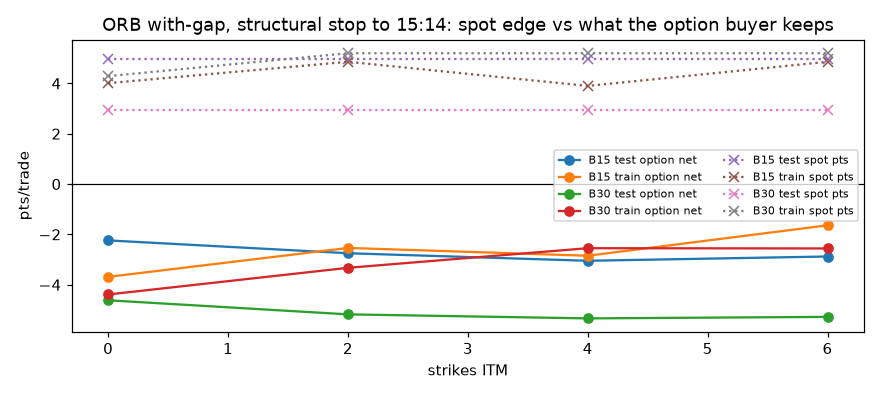
By direction (all periods): on short signals spot gains +13.3 pts, the ATM put gains +3.2 before costs, and the 6-ITM put +6.6. On long signals spot loses −3.9 and calls lose −6. Over 3–5 hours a long weekly option gives back roughly 3–6 pts to theta and the falling intraday IV. That is the same size as the spot edge.
Random ATM buys by entry time (REAL cost)
| ex |
hm |
E0 |
E1 |
E4 |
|
09:20 |
-2.29 |
-4.38 |
-2.51 |
|
09:30 |
-2.53 |
-4.02 |
-3.12 |
|
09:45 |
-2.59 |
-3.86 |
-2.31 |
|
10:15 |
-2.78 |
-2.11 |
-2.26 |
|
11:00 |
-2.86 |
-2.83 |
-2.80 |
|
12:00 |
-2.53 |
-2.07 |
-2.40 |
|
13:00 |
-3.05 |
-2.97 |
-2.91 |
|
14:00 |
-2.84 |
-2.80 |
-3.17 |
6. Follow-up (asked 26-Oct-2026 18:06 IST): “trail the profit at 50% after 1:2” instead of a fixed exit
Verdict: the trail does not rescue any strategy.
- Train results got worse on 5 of 6 strategies compared with the old exits. O30 is the exception, and it has only 17 trades. The 2026 results moved in both directions.
- Only the trend-day filter E is positive in 2026 at +9.6 pts/trade (₹622/lot, n=28, p=0.20). The same rule lost -12.0 pts/trade on train and sits at the 5th percentile versus random there. That is a regime flip, not an edge.
- BH over the 6 primary tests: all q≈0.99.
- The post-hoc gap-down ORB put lead (2-ITM put) is +6.7 / +7.3 pts in 2026 against −1.2 / +0.4 on train. It stays forward-watch only.
- Honesty note: this exit was proposed after the 2026 results were seen, so 2026 is no longer fully untouched for it. Train-vs-random and the per-year rows are the fairer read, and they are negative.
Exit rules.
- The initial stop is each strategy's structural spot stop (R clipped to 15–70 pts). It is checked on 1-min high/low, exactly as before.
- There is no breakeven move, no scale-out and no target.
- Once the peak open profit on 1-min spot closes reaches 2R, the stop becomes entry + 50% of peak profit. It only ratchets up and is checked on 1-min closes.
- Every exit fills at the next minute's option open. The time exit is the 15:15 option open (the last real spot minute is 15:14). No overnight holds.
- Premium version (secondary): same structural spot stop, but the trail runs on option 1-min closes with Rprem=0.5×R (ATM delta ≈0.5).
- Everything else is identical to sections 3–4: ATM, nearest weekly with DTE≥1, 0.5 pt slippage per side plus real charges, and STT 0.15% from 1-Apr-2026.
- Lot sizes: 25 before 20-Nov-2024, 75 to Dec-2025, 65 in 2026.
- Random baseline: same time, same direction and same R on 30 random days from the same period, with the same exit.
Disclosure: rule C allows up to 3 triggers a day, as in the recoveries rule. 20 trades in 15 days were extra. With the first trigger only, C is −5.4 (train) and −11.7 (2026), so the verdict does not change.
Primary: spot-based trail, 6 pre-declared strategies
| cand |
mode |
inst |
split |
n |
mean |
median |
win |
avg_win |
avg_loss |
payoff |
rs_per_trade |
rs_total |
maxdd_rs |
worst_month |
worst_month_rs |
random_mean |
random_pctile |
t_p_one |
q_bh |
| A |
spot |
ATM |
train |
17 |
3.89 |
-25.50 |
29.41 |
100.69 |
-36.45 |
2.76 |
470.73 |
8,002.44 |
-21,090.90 |
2025-04 |
-9,860.44 |
-5.28 |
82.75 |
0.42 |
– |
| A |
spot |
ATM |
test |
9 |
-7.14 |
-29.75 |
33.33 |
54.96 |
-38.19 |
1.44 |
-464.17 |
-4,177.53 |
-12,314.76 |
2026-04 |
-3,250.52 |
-1.67 |
41.65 |
0.65 |
0.99 |
| B15 |
spot |
ATM |
train |
133 |
-3.90 |
-15.48 |
36.84 |
38.16 |
-28.43 |
1.34 |
-209.29 |
-27,835.68 |
-38,923.19 |
2025-05 |
-15,993.87 |
-4.50 |
57.45 |
0.87 |
– |
| B15 |
spot |
ATM |
test |
99 |
-0.67 |
-19.96 |
27.27 |
70.01 |
-27.18 |
2.58 |
-43.67 |
-4,323.64 |
-56,253.62 |
2026-05 |
-17,460.26 |
-3.67 |
74.85 |
0.55 |
0.99 |
| B30 |
spot |
ATM |
train |
124 |
-3.49 |
-15.20 |
36.29 |
42.19 |
-29.52 |
1.43 |
-217.38 |
-26,955.64 |
-37,691.72 |
2025-05 |
-20,503.40 |
-4.05 |
56.85 |
0.82 |
– |
| B30 |
spot |
ATM |
test |
96 |
-2.10 |
-18.44 |
29.17 |
59.72 |
-27.56 |
2.17 |
-136.60 |
-13,113.55 |
-61,637.63 |
2026-05 |
-12,615.14 |
-2.42 |
55.50 |
0.66 |
0.99 |
| C |
spot |
ATM |
train |
56 |
-6.93 |
-22.90 |
30.36 |
52.51 |
-32.83 |
1.60 |
-336.17 |
-18,825.51 |
-28,899.31 |
2025-04 |
-17,772.42 |
-4.58 |
32.10 |
0.81 |
– |
| C |
spot |
ATM |
test |
57 |
-10.24 |
-22.35 |
31.58 |
29.14 |
-28.41 |
1.03 |
-665.45 |
-37,930.74 |
-46,184.02 |
2026-05 |
-19,820.97 |
-6.68 |
26.45 |
0.99 |
0.99 |
| D |
spot |
ATM |
train |
88 |
-6.52 |
-11.49 |
25.00 |
24.24 |
-16.77 |
1.45 |
-519.23 |
-45,692.41 |
-60,283.74 |
2025-06 |
-12,341.42 |
-2.48 |
6.65 |
0.98 |
– |
| D |
spot |
ATM |
test |
57 |
-6.18 |
-11.22 |
31.58 |
18.18 |
-17.43 |
1.04 |
-401.86 |
-22,905.80 |
-27,540.30 |
2026-02 |
-7,622.31 |
-1.90 |
12.20 |
0.96 |
0.99 |
| E |
spot |
ATM |
train |
40 |
-12.03 |
-26.26 |
30.00 |
37.53 |
-33.27 |
1.13 |
-900.26 |
-36,010.50 |
-45,050.56 |
2025-02 |
-14,110.76 |
-1.28 |
5.10 |
0.96 |
– |
| E |
spot |
ATM |
test |
28 |
9.56 |
-12.65 |
46.43 |
62.14 |
-36.00 |
1.73 |
621.64 |
17,405.83 |
-17,915.64 |
2026-06 |
-4,957.85 |
-1.95 |
89.20 |
0.20 |
0.99 |
Trail vs the old exits (same trades, pts/trade)
| cand |
train_best_old |
train_E0 |
train_trail50 |
test_E0 |
test_trail50 |
| A |
3.07 |
-1.68 |
3.89 |
-9.66 |
-7.14 |
| B15 |
-0.13 |
-0.51 |
-3.90 |
-1.04 |
-0.67 |
| B30 |
-1.18 |
-1.81 |
-3.49 |
-4.07 |
-2.10 |
| C |
-1.97 |
-5.49 |
-6.93 |
-0.72 |
-10.24 |
| D |
-3.68 |
-3.99 |
-6.52 |
-5.16 |
-6.18 |
| E |
-3.90 |
-3.90 |
-12.03 |
0.93 |
9.56 |
Per year (primary trail; the L rows are the post-hoc lead, 2-ITM puts)
| cand |
year |
n |
mean |
win |
rs |
| A |
2024 |
5 |
-17.3 |
20.0 |
-3,434.7 |
| A |
2025 |
12 |
12.7 |
33.3 |
11,437.2 |
| A |
2026 |
9 |
-7.1 |
33.3 |
-4,177.5 |
| B15 |
2024 |
22 |
-15.5 |
27.3 |
-14,563.9 |
| B15 |
2025 |
111 |
-1.6 |
38.7 |
-13,271.8 |
| B15 |
2026 |
99 |
-0.7 |
27.3 |
-4,323.6 |
| B30 |
2024 |
20 |
-9.3 |
35.0 |
-8,406.2 |
| B30 |
2025 |
104 |
-2.4 |
36.5 |
-18,549.5 |
| B30 |
2026 |
96 |
-2.1 |
29.2 |
-13,113.5 |
| C |
2024 |
20 |
-1.9 |
35.0 |
7,463.0 |
| C |
2025 |
36 |
-9.7 |
27.8 |
-26,288.5 |
| C |
2026 |
57 |
-10.2 |
31.6 |
-37,930.7 |
| D |
2024 |
6 |
2.9 |
50.0 |
-1,363.6 |
| D |
2025 |
82 |
-7.2 |
23.2 |
-44,328.8 |
| D |
2026 |
57 |
-6.2 |
31.6 |
-22,905.8 |
| E |
2024 |
6 |
-9.7 |
50.0 |
-4,276.9 |
| E |
2025 |
34 |
-12.4 |
26.5 |
-31,733.6 |
| E |
2026 |
28 |
9.6 |
46.4 |
17,405.8 |
| L15 |
2024 |
11 |
-13.9 |
27.3 |
-5,562.0 |
| L15 |
2025 |
47 |
1.8 |
46.8 |
6,421.5 |
| L15 |
2026 |
53 |
6.7 |
26.4 |
22,939.5 |
| L30 |
2024 |
8 |
14.0 |
50.0 |
4,587.5 |
| L30 |
2025 |
43 |
-2.2 |
46.5 |
-6,957.9 |
| L30 |
2026 |
49 |
7.3 |
30.6 |
23,333.6 |
per-month CSV
Sensitivity (spot trail, ATM; activation 1.5/2/3R at 50%, lock 40/50/60% at 2R). Reported only; nothing was picked from it.
| cand |
act |
lock |
count_test |
count_train |
mean_test |
mean_train |
| A |
1.50 |
0.50 |
9 |
17 |
-7.14 |
3.89 |
| A |
2.00 |
0.40 |
9 |
17 |
-9.07 |
2.98 |
| A |
2.00 |
0.50 |
9 |
17 |
-7.14 |
3.89 |
| A |
2.00 |
0.60 |
9 |
17 |
-7.14 |
-5.68 |
| A |
3.00 |
0.50 |
9 |
17 |
-11.93 |
6.47 |
| B15 |
1.50 |
0.50 |
99 |
133 |
-1.83 |
-2.64 |
| B15 |
2.00 |
0.40 |
99 |
133 |
-0.55 |
-3.99 |
| B15 |
2.00 |
0.50 |
99 |
133 |
-0.67 |
-3.90 |
| B15 |
2.00 |
0.60 |
99 |
133 |
-0.57 |
-3.04 |
| B15 |
3.00 |
0.50 |
99 |
133 |
-1.24 |
-3.87 |
| B30 |
1.50 |
0.50 |
96 |
124 |
-4.24 |
-2.91 |
| B30 |
2.00 |
0.40 |
96 |
124 |
-2.70 |
-3.73 |
| B30 |
2.00 |
0.50 |
96 |
124 |
-2.10 |
-3.49 |
| B30 |
2.00 |
0.60 |
96 |
124 |
-1.67 |
-3.57 |
| B30 |
3.00 |
0.50 |
96 |
124 |
-3.76 |
-4.75 |
| C |
1.50 |
0.50 |
57 |
56 |
-7.38 |
-7.14 |
| C |
2.00 |
0.40 |
57 |
56 |
-11.96 |
-8.57 |
| C |
2.00 |
0.50 |
57 |
56 |
-10.24 |
-6.93 |
| C |
2.00 |
0.60 |
57 |
56 |
-8.91 |
-5.06 |
| C |
3.00 |
0.50 |
57 |
56 |
-4.25 |
-10.50 |
| D |
1.50 |
0.50 |
57 |
88 |
-5.36 |
-7.65 |
| D |
2.00 |
0.40 |
57 |
88 |
-7.67 |
-6.40 |
| D |
2.00 |
0.50 |
57 |
88 |
-6.18 |
-6.52 |
| D |
2.00 |
0.60 |
57 |
88 |
-7.96 |
-5.71 |
| D |
3.00 |
0.50 |
57 |
88 |
-8.01 |
-6.34 |
| E |
1.50 |
0.50 |
28 |
40 |
16.29 |
-10.30 |
| E |
2.00 |
0.40 |
28 |
40 |
9.71 |
-13.42 |
| E |
2.00 |
0.50 |
28 |
40 |
9.56 |
-12.03 |
| E |
2.00 |
0.60 |
28 |
40 |
9.83 |
-11.45 |
| E |
3.00 |
0.50 |
28 |
40 |
8.27 |
-17.13 |
Secondary: premium-based trail
| cand |
mode |
inst |
split |
n |
mean |
median |
win |
avg_win |
avg_loss |
payoff |
rs_per_trade |
rs_total |
maxdd_rs |
worst_month |
worst_month_rs |
random_mean |
random_pctile |
t_p_one |
q_bh |
| A |
prem |
ATM |
train |
17 |
4.78 |
-25.50 |
29.41 |
103.72 |
-36.45 |
2.85 |
537.48 |
9,137.08 |
-21,090.90 |
2025-04 |
-9,860.44 |
-4.72 |
86.05 |
0.41 |
– |
| A |
prem |
ATM |
test |
9 |
-7.14 |
-29.75 |
33.33 |
54.96 |
-38.19 |
1.44 |
-464.17 |
-4,177.53 |
-12,314.76 |
2026-04 |
-3,250.52 |
-2.06 |
41.60 |
0.65 |
– |
| B15 |
prem |
ATM |
train |
133 |
-0.92 |
-15.05 |
42.10 |
37.83 |
-29.11 |
1.30 |
6.21 |
826.22 |
-28,158.78 |
2025-05 |
-15,825.36 |
-3.87 |
80.80 |
0.60 |
– |
| B15 |
prem |
ATM |
test |
99 |
-0.76 |
-19.85 |
30.30 |
61.72 |
-27.93 |
2.21 |
-49.68 |
-4,918.76 |
-53,934.32 |
2026-05 |
-17,460.26 |
-3.46 |
73.95 |
0.56 |
– |
| B30 |
prem |
ATM |
train |
124 |
-2.71 |
-15.33 |
39.52 |
40.11 |
-30.69 |
1.31 |
-162.94 |
-20,204.45 |
-36,017.79 |
2025-05 |
-12,987.79 |
-3.98 |
62.35 |
0.77 |
– |
| B30 |
prem |
ATM |
test |
96 |
-2.21 |
-18.22 |
31.25 |
54.54 |
-28.00 |
1.95 |
-143.55 |
-13,781.23 |
-56,854.13 |
2026-05 |
-12,615.14 |
-1.95 |
50.80 |
0.68 |
– |
| C |
prem |
ATM |
train |
56 |
-4.08 |
-21.59 |
33.93 |
50.08 |
-31.89 |
1.57 |
-292.53 |
-16,381.48 |
-26,229.34 |
2025-04 |
-16,892.41 |
-3.29 |
42.70 |
0.70 |
– |
| C |
prem |
ATM |
test |
57 |
-7.12 |
-21.07 |
35.09 |
30.18 |
-27.27 |
1.11 |
-462.45 |
-26,359.40 |
-36,496.15 |
2026-05 |
-16,259.30 |
-5.71 |
41.60 |
0.96 |
– |
| D |
prem |
ATM |
train |
88 |
-3.69 |
-10.82 |
31.82 |
24.20 |
-16.71 |
1.45 |
-324.82 |
-28,584.14 |
-47,498.33 |
2025-05 |
-9,431.94 |
-2.19 |
31.05 |
0.88 |
– |
| D |
prem |
ATM |
test |
57 |
-6.74 |
-11.07 |
38.60 |
12.25 |
-18.67 |
0.66 |
-437.92 |
-24,961.46 |
-29,243.63 |
2026-01 |
-7,684.69 |
-1.71 |
7.05 |
1.00 |
– |
| E |
prem |
ATM |
train |
40 |
-9.82 |
-25.66 |
32.50 |
38.61 |
-33.13 |
1.17 |
-762.86 |
-30,514.54 |
-41,234.95 |
2025-02 |
-14,110.76 |
-1.53 |
9.90 |
0.92 |
– |
| E |
prem |
ATM |
test |
28 |
12.46 |
-4.15 |
50.00 |
60.91 |
-35.98 |
1.69 |
810.24 |
22,686.75 |
-16,987.45 |
2026-06 |
-4,867.02 |
-1.55 |
92.10 |
0.13 |
– |
Post-hoc lead: gap-down ORB, puts 2/4 ITM, spot trail. Labelled post-hoc.
| cand |
mode |
inst |
split |
n |
mean |
median |
win |
avg_win |
avg_loss |
payoff |
rs_per_trade |
rs_total |
maxdd_rs |
worst_month |
worst_month_rs |
random_mean |
random_pctile |
t_p_one |
q_bh |
| L15 |
spot |
ITM2 |
train |
58 |
-1.15 |
-20.50 |
43.10 |
45.13 |
-36.21 |
1.25 |
14.82 |
859.49 |
-28,007.88 |
2025-05 |
-12,747.98 |
-2.88 |
61.85 |
0.57 |
– |
| L15 |
spot |
ITM2 |
test |
53 |
6.66 |
-21.11 |
26.41 |
108.36 |
-29.85 |
3.63 |
432.82 |
22,939.50 |
-35,429.14 |
2026-08 |
-8,823.24 |
0.27 |
78.00 |
0.25 |
– |
| L15 |
spot |
ITM4 |
train |
57 |
-2.12 |
-27.81 |
43.86 |
50.23 |
-43.02 |
1.17 |
-47.19 |
-2,689.96 |
-31,518.76 |
2025-05 |
-13,671.76 |
– |
– |
0.61 |
– |
| L15 |
spot |
ITM4 |
test |
53 |
7.19 |
-24.52 |
33.96 |
96.14 |
-38.55 |
2.49 |
467.42 |
24,773.47 |
-41,086.13 |
2026-08 |
-10,732.92 |
– |
– |
0.26 |
– |
| L30 |
spot |
ITM2 |
train |
51 |
0.38 |
-10.55 |
47.06 |
44.39 |
-38.75 |
1.15 |
-46.48 |
-2,370.38 |
-21,892.52 |
2025-05 |
-10,409.64 |
-2.09 |
64.25 |
0.48 |
– |
| L30 |
spot |
ITM2 |
test |
49 |
7.33 |
-20.97 |
30.61 |
96.73 |
-32.12 |
3.01 |
476.20 |
23,333.58 |
-38,930.08 |
2026-04 |
-9,668.13 |
3.03 |
69.95 |
0.23 |
– |
| L30 |
spot |
ITM4 |
train |
51 |
1.68 |
-12.37 |
47.06 |
54.55 |
-45.31 |
1.20 |
36.77 |
1,875.28 |
-26,123.07 |
2025-05 |
-11,464.24 |
– |
– |
0.42 |
– |
| L30 |
spot |
ITM4 |
test |
49 |
7.97 |
-23.09 |
34.69 |
97.97 |
-39.85 |
2.46 |
517.92 |
25,377.95 |
-45,892.93 |
2026-08 |
-10,835.05 |
– |
– |
0.24 |
– |
How much of the spot ORB edge does the option keep with this exit?
Spot proxy with the same trail (index points, no costs), 2022–2026:
| cand |
2022 |
2023 |
2024 |
2025 |
2026 |
all |
p |
| A |
-56.9 |
-8.2 |
-40.1 |
19.2 |
-10.4 |
-15.1 |
0.3 |
| B15 |
5.3 |
1.8 |
3.2 |
7.4 |
5.9 |
4.7 |
0.2 |
| B30 |
11.3 |
2.5 |
6.2 |
9.1 |
6.6 |
7.1 |
0.1 |
| C |
– |
– |
7.8 |
1.5 |
-10.3 |
-3.2 |
0.6 |
| D |
– |
– |
15.6 |
-6.6 |
-1.9 |
-3.6 |
0.4 |
| E |
– |
– |
-0.0 |
-12.5 |
24.3 |
3.8 |
0.7 |
Option gross before slippage versus spot points on the same trades:
| cand |
inst |
split |
n |
spot_pts |
opt_gross_ex_slip |
net |
capture_pct |
| B15 |
ATM |
test |
99 |
6.56 |
1.38 |
-0.67 |
21.10 |
| B15 |
ATM |
train |
133 |
2.26 |
-1.94 |
-3.90 |
-85.68 |
| L15 (puts) |
ITM2 |
test |
53 |
18.78 |
8.82 |
6.66 |
46.99 |
| L15 (puts) |
ITM2 |
train |
58 |
7.50 |
0.90 |
-1.15 |
11.97 |
| L15 (puts) |
ITM4 |
test |
53 |
18.78 |
9.50 |
7.19 |
50.57 |
| L15 (puts) |
ITM4 |
train |
57 |
5.31 |
0.05 |
-2.12 |
0.92 |
| B30 |
ATM |
test |
96 |
6.56 |
-0.05 |
-2.10 |
-0.81 |
| B30 |
ATM |
train |
124 |
5.71 |
-1.54 |
-3.49 |
-26.90 |
| L30 (puts) |
ITM2 |
test |
49 |
20.99 |
9.48 |
7.33 |
45.17 |
| L30 (puts) |
ITM2 |
train |
51 |
13.38 |
2.39 |
0.37 |
17.87 |
| L30 (puts) |
ITM4 |
test |
49 |
20.99 |
10.26 |
7.97 |
48.89 |
| L30 (puts) |
ITM4 |
train |
51 |
13.38 |
3.82 |
1.68 |
28.55 |
With this exit, ORB30 still makes about +7 spot pts/trade over 2022–26 (p=0.05). The ATM option keeps about 0% of it (ORB15 about 21% in 2026 and negative in train). ITM puts on the gap-down side keep 45–50% in 2026 but only 1–29% in train.
Case: 26-Oct-2026 (full-session Upstox intraday, fetched read-only after the close; spot 15:15+ treated as missing)
Gap −75.6 (open 22,524.4 vs the 23-Oct close of 22,600). No ORB with-gap signal and no O30 or VWAP-pullback signal fired. Rule C fired at 09:16 and 09:26, and E fired at 10:14 (long).
| cand |
signal |
dir |
R |
mode |
inst |
K |
typ |
fill |
exit_min |
why |
pnl |
pnl_rs |
spot_pts |
| E |
10:14 |
1 |
70.00 |
spot |
ATM |
22,700.00 |
CE |
166.40 |
10:39 |
stop |
-56.61 |
-3,679.80 |
-86.20 |
| E |
10:14 |
1 |
70.00 |
prem |
ATM |
22,700.00 |
CE |
166.40 |
10:39 |
stop |
-56.61 |
-3,679.80 |
-86.20 |
| E |
10:14 |
1 |
– |
old_E0 |
ATM |
22,700.00 |
CE |
166.40 |
10:16 |
prem_stop |
-21.58 |
-1,402.66 |
– |
| E |
10:14 |
1 |
– |
old_E1 |
ATM |
22,700.00 |
CE |
166.40 |
10:39 |
stop |
-56.61 |
-3,679.80 |
– |
| C |
09:16 |
1 |
45.50 |
spot |
ATM |
22,500.00 |
CE |
170.80 |
09:18 |
stop |
-28.63 |
-1,860.71 |
-47.00 |
| C |
09:16 |
1 |
45.50 |
prem |
ATM |
22,500.00 |
CE |
170.80 |
09:18 |
stop |
-28.63 |
-1,860.71 |
-47.00 |
| C |
09:16 |
1 |
– |
old_E0 |
ATM |
22,500.00 |
CE |
170.80 |
09:17 |
prem_stop |
-21.59 |
-1,403.34 |
– |
| C |
09:16 |
1 |
– |
old_E1 |
ATM |
22,500.00 |
CE |
170.80 |
09:18 |
stop |
-28.63 |
-1,860.71 |
– |
| C |
09:26 |
1 |
35.90 |
spot |
ATM |
22,400.00 |
CE |
171.10 |
11:34 |
trail |
79.07 |
5,139.31 |
127.50 |
| C |
09:26 |
1 |
35.90 |
prem |
ATM |
22,400.00 |
CE |
171.10 |
09:33 |
trail |
16.69 |
1,084.59 |
127.50 |
| C |
09:26 |
1 |
– |
old_E0 |
ATM |
22,400.00 |
CE |
171.10 |
09:31 |
prem_stop |
26.26 |
1,706.91 |
– |
| C |
09:26 |
1 |
– |
old_E1 |
ATM |
22,400.00 |
CE |
171.10 |
15:15 |
time |
210.51 |
13,683.43 |
– |
Trail result today: C 09:16 −28.6, C 09:26 +79.1 (trailed out at 11:34), E −56.6. Net −6.2 pts (≈−₹400/lot). Holding the 09:26 call to the close (old E1) would have made +210.5. One day like this is what makes the tail look attractive, but over two years the stops cost more than the tail pays.
5. Data, limits, gaps
- Options: Upstox expired-instrument 1-min chains, panels from 21-Oct-2024 (the 1–18 Oct 2024 days are not in the panel cache) to 23-Oct-2026. 90 of 12,150 simulated rows had no option bar at the entry minute and were skipped, never filled. Some days have thin strike coverage (e.g. 2024-12-20).
- No option volume in the panel. VWAP = spot typical price weighted by Nifty futures volume, available from Oct-2024 only.
- Bid-ask comes from 11 sessions of Oct-2026 only. 2024–25 spreads are assumed similar.
- Sample sizes: O30 has 17 train and 9 test trades, which is too few for any conclusion. Others have 28–133.
- Exits trigger on 1-min spot bars and fill at the next option open. Real intra-minute stop fills could be better or worse.
- Option selling and futures are out of scope.
Files: results · scripts · charts · pre-registration. Related: intraday recoveries, flow forensics, opening-30m rule.