How Nifty 50 responds to sectors, oil, the Dow, the rupee and rates
Daily data 2012-01-03 → 2026-10-09 · train 2012-2022, frozen test 2023-2026 · generated 2026-10-10 11:11 IST · descriptive research, not trading advice.
Takeaways
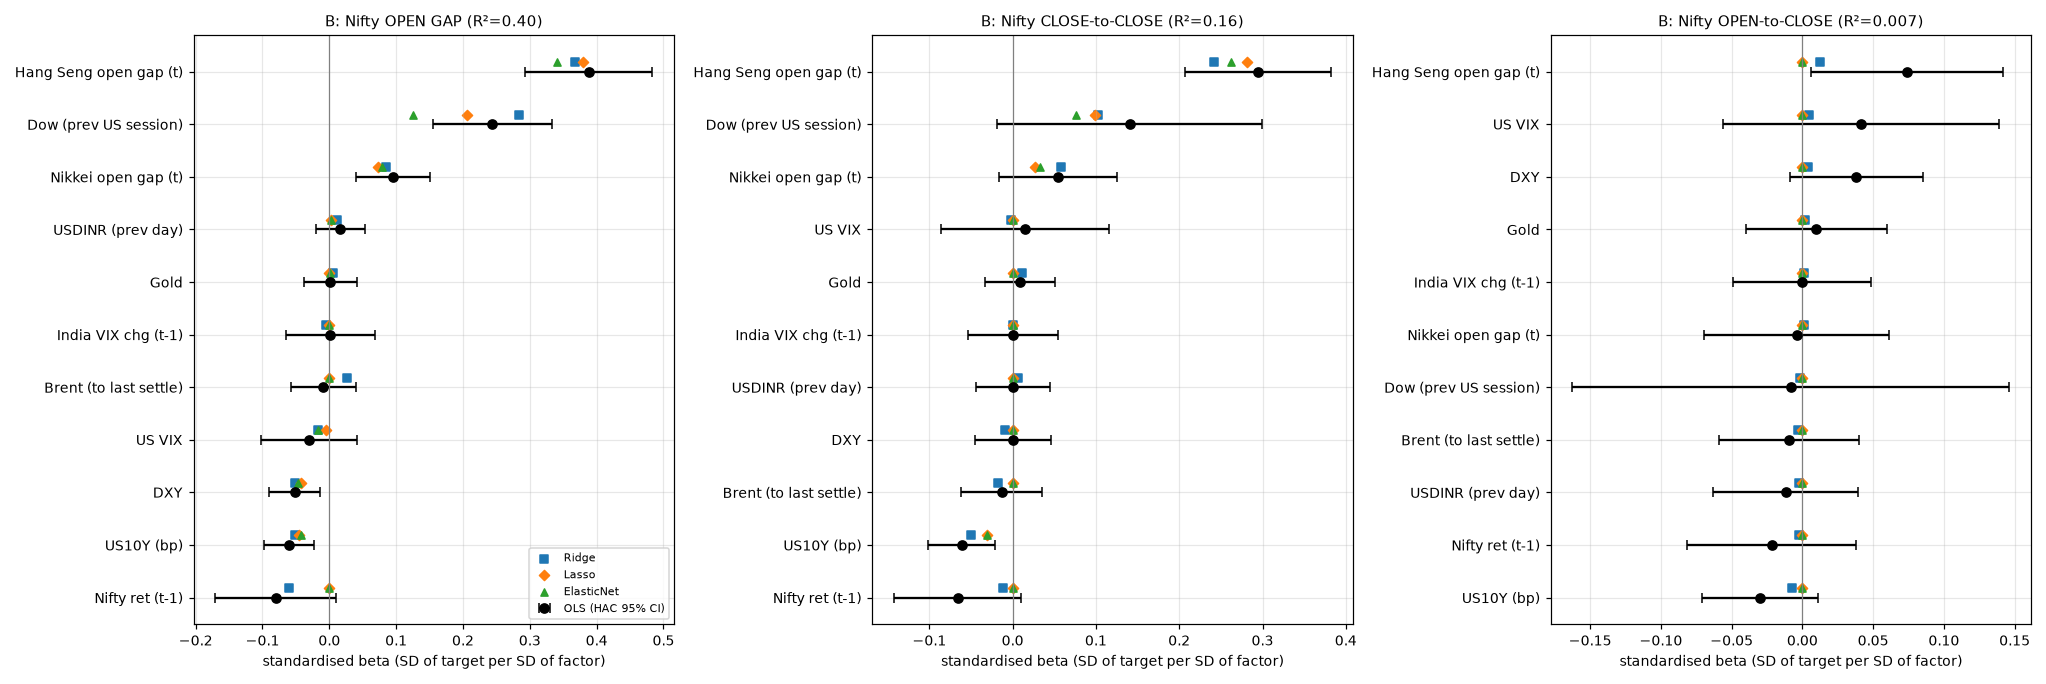
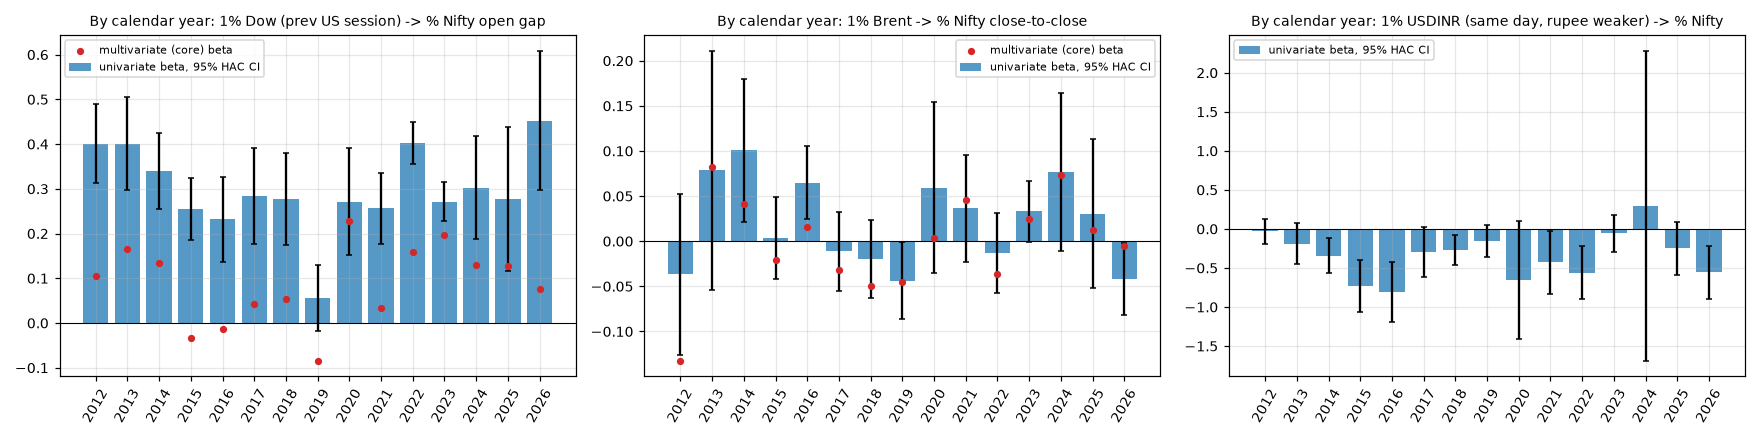
Overnight Dow -> opening gap is the strongest single sensitivity. A 1% move in the Dow in the prior US session is associated with a +0.29% (95% CI +0.24 to +0.34) Nifty open gap on its own (R² 0.23, 2012-2026). Holding Asia's opening moves etc. fixed it is +0.15% (95% CI +0.09 to +0.20), because Hang Seng/Nikkei openings already carry part of the US signal. Year by year the univariate Dow->gap beta ranged 0.06 (2019) to 0.45 (2026), mostly 0.25-0.40.
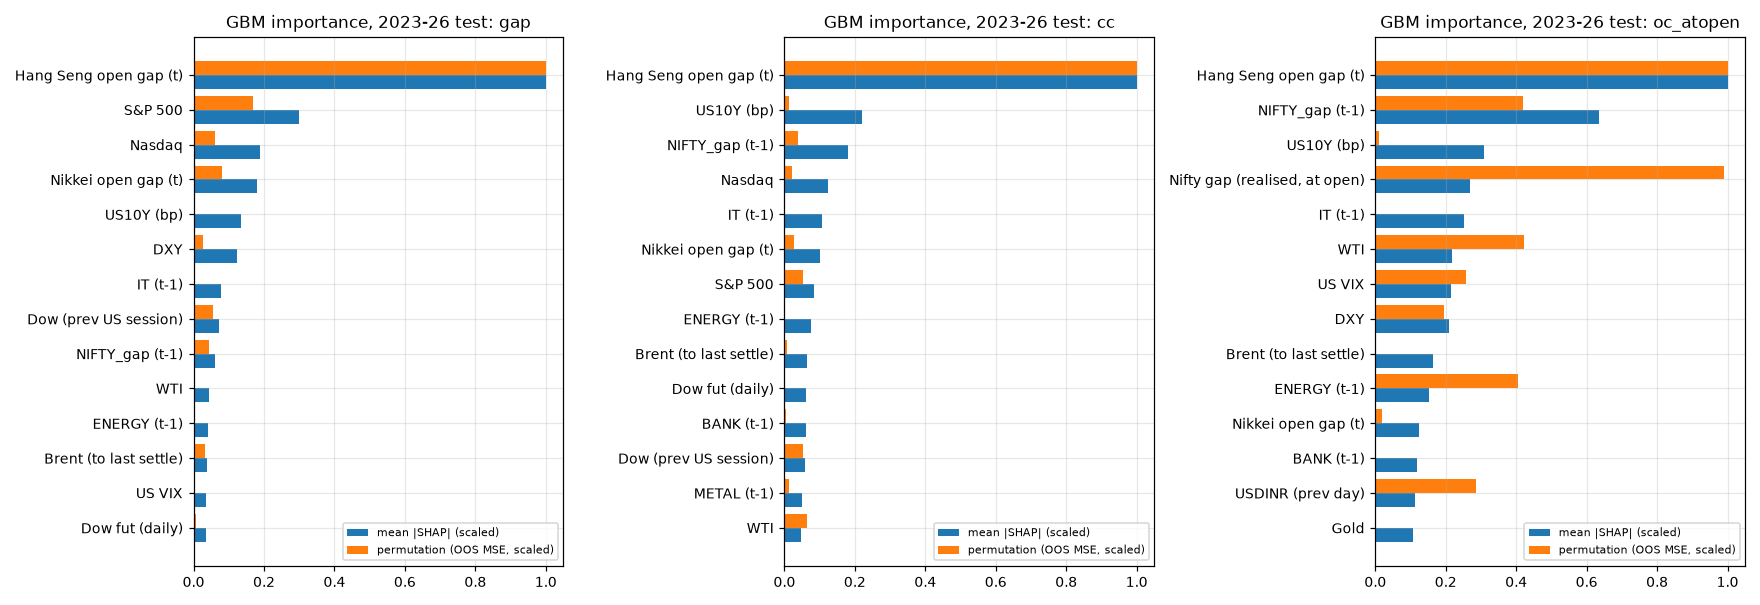
Asia's open is even more informative than the Dow. The Hang Seng open gap (07:00 IST) has a beta of +0.42% (95% CI +0.37 to +0.48) on the Nifty gap and is the #1 feature in every model (OLS, Lasso, GBM SHAP/permutation). The Dow-futures drift after the US cash close (16:00 ET -> 08:30 IST, hourly YM=F, only 593 days since May-2024) adds a further +0.62% per 1% on top of the cash Dow (+0.31), lifting gap R² from 0.23 to 0.37.
Oil barely matters for Nifty day to day. 1% Brent -> +0.03% (95% CI +0.01 to +0.04) on the gap and +0.02% (95% CI -0.01 to +0.04) close-to-close (univariate; R² ≈ 0.010). In the multivariate ex-Covid model it is -0.01% (95% CI -0.02 to -0.00) - i.e. a 10% oil spike ≈ -0.1% on the open. The sign flips across years (positive when oil rises with global risk-on, negative in supply shocks); there is no stable, tradeable oil beta at daily horizon.
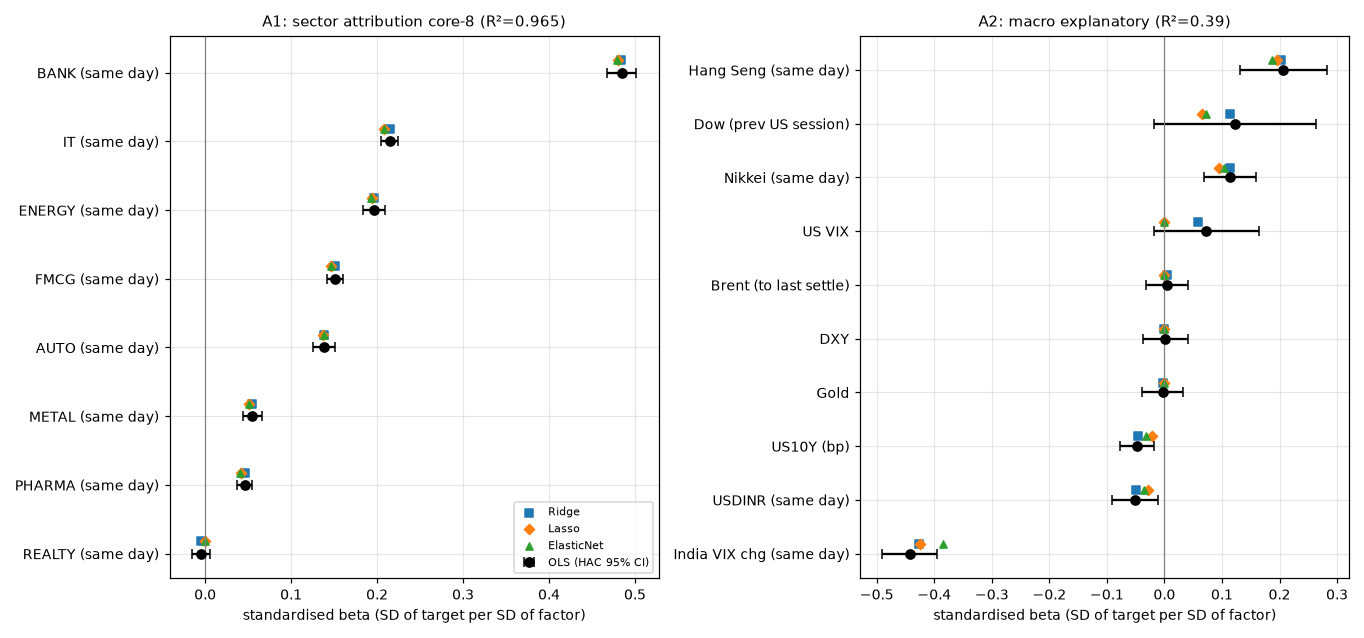
Rupee and rates: same-day USDINR (rupee weakening 1%) goes with -0.12% (95% CI -0.22 to -0.02) Nifty (concurrent, explanatory only, and Granger runs Nifty -> USDINR, not the reverse). Yesterday's USDINR has no forecasting power. US 10-year yield: +10bp overnight ≈ -0.07% on the gap (CI -0.12 to -0.03). India VIX change same day is the strongest concurrent macro variable (std beta -0.44) - it moves with the market, it does not lead it.
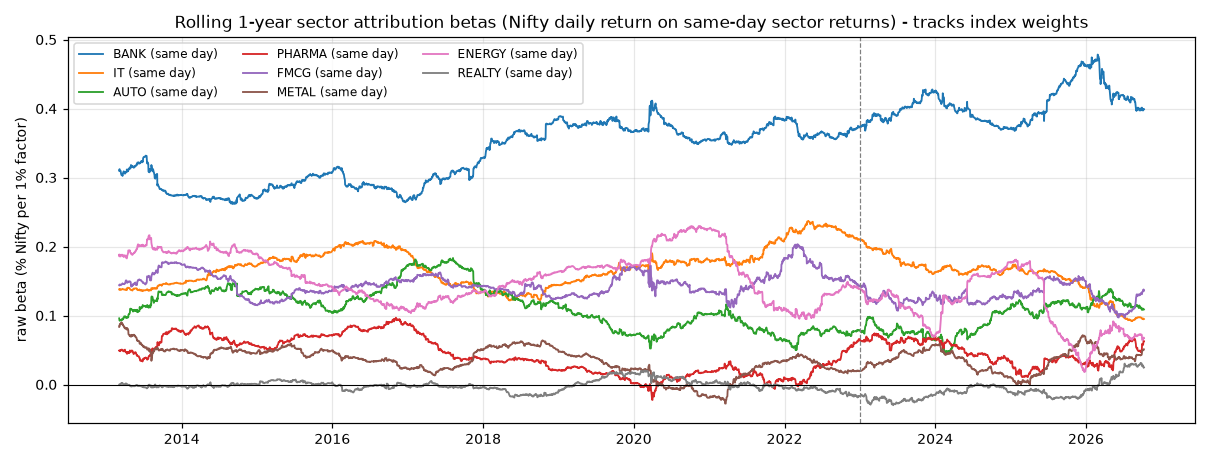
Sector attribution (near-mechanical): Bank (0.35), IT (0.16), Energy (0.15), FMCG (0.15) and Auto (0.11) explain 96.5% of daily Nifty variance; the betas track index weights (Bank beta rose from ~0.30 in 2012 to ~0.37-0.46 in 2023-26; Energy fell). This is accounting, not prediction - adding lagged sector returns to the forecasting models (full vs core set) does not improve out-of-sample fit.
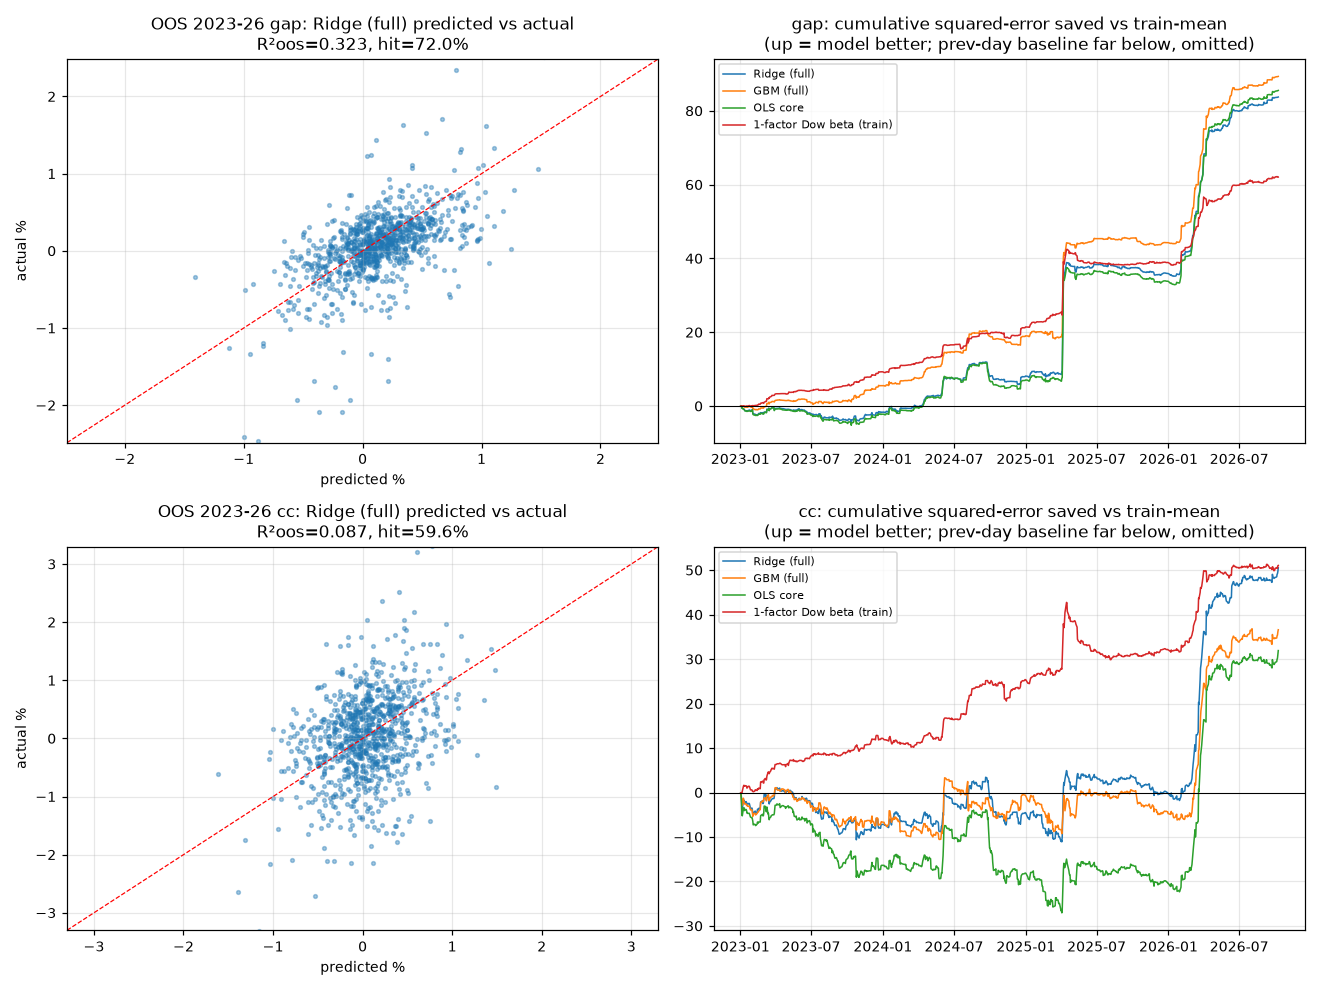
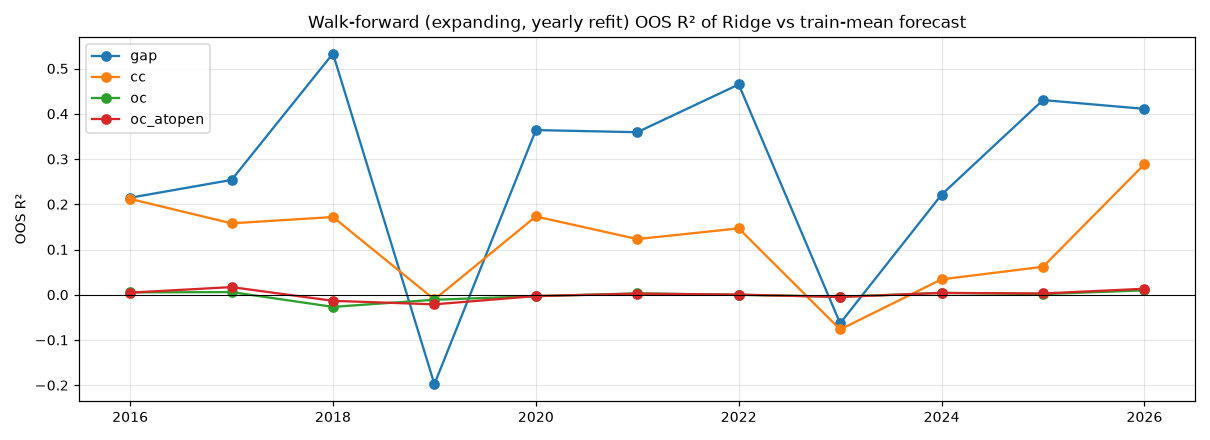
Forecasting power is real only for the OPEN GAP, and it is already priced at 09:15. Frozen 2012-22 models on 2023-26: gap OOS R² 0.33-0.34, direction hit 72% vs 61% always-up. Close-to-close OOS R² is only 0.09 (and ~97% of that comes from 10 shock days; excluding them ≈ 0.02) - it is the gap leaking into cc. Open-to-close (what you can trade after the open) has OOS R² ≈ +0.002: no forecasting power, not even with the realised gap. Regularised and nonlinear models do not beat plain OLS meaningfully.
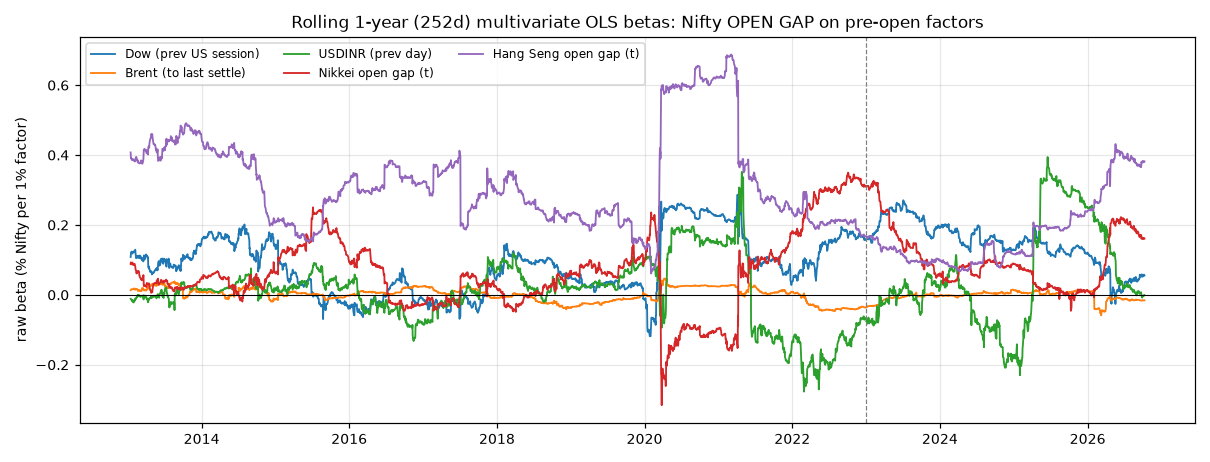
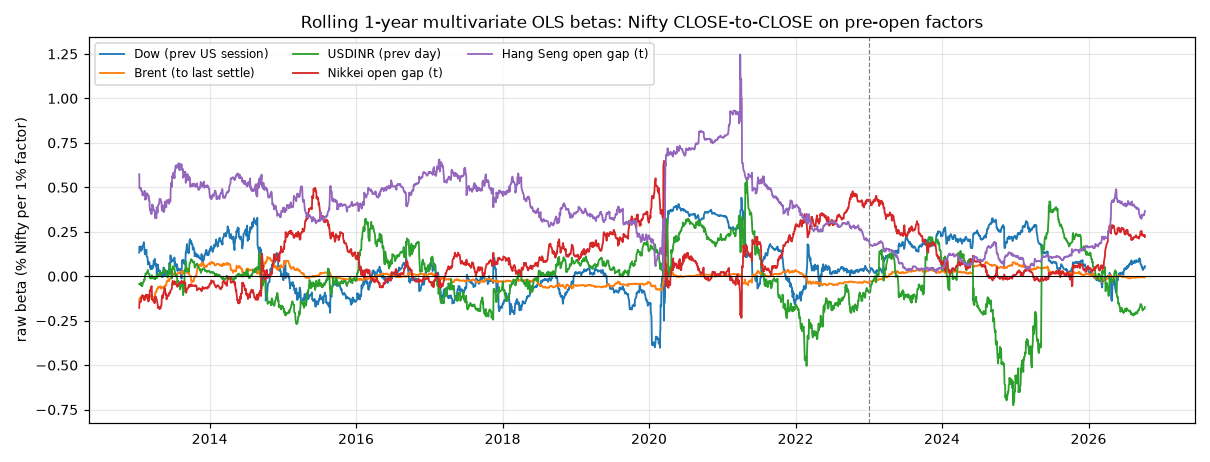
Honesty notes. (1) Sector 'betas' are attribution of an index to its own constituents, not causes. (2) The only robust predictability is in the opening gap, which is already in the price at 09:15. (3) Close-to-close OOS gains are concentrated in a handful of shock days (e.g. 7-Apr-2025, Mar/Apr-2026). (4) Betas drift: see the rolling charts before using any single number.
Data & method
Data: Yahoo Finance daily (free) 2012-01-03 to 2026-10-09, 3627 Nifty sessions. Yahoo only has full history for ^NSEBANK, ^CNXIT, ^CNXPHARMA, so all sector indices come from NSE's free daily index archive (ind_close_all_*.csv, 3,598 files; NSE Nifty closes match Yahoo exactly). Factors: Brent BZ=F, WTI CL=F, ^DJI, YM=F, ^GSPC, ^IXIC, INR=X (5 bad prints removed), ^INDIAVIX, ^TNX, DX-Y.NYB, GC=F, ^N225, ^HSI, ^VIX. Log returns in %.
Timing: US session dated d closes 01:30/02:30 IST on d+1, so for Nifty day t a "pre-open" factor is its last close strictly before date t, differenced against the same for the previous Nifty session (cumulates multiple US sessions over Indian holidays). Nikkei (opens 05:30 IST) and Hang Seng (07:00 IST) open gaps on day t are also known before 09:15. India VIX, sectors and Nifty enter lagged one session. The Nikkei index 'open' is computed partly from stale prices, which understates its gap. Oil daily settle is used (no intraday oil -> overnight Asia-hours oil moves are not captured).
Targets: gap = ln(Open_t/Close_t-1), oc = ln(Close_t/Open_t), cc = ln(Close_t/Close_t-1). Models: OLS (HAC/Newey-West 5 lags, raw + standardised), Ridge/Lasso/ElasticNet (CV with TimeSeriesSplit), rolling 252-day OLS, quantile regression, gradient boosting with SHAP and permutation importance, Granger causality, Engle-Granger on levels. Validation: train 2012-2022, frozen, single test 2023-2026, plus expanding walk-forward 2016-2026. Descriptive research - no trading costs, not trading advice.
1. Headline sensitivities (forecasting framing: info known before 09:15 IST)
Univariate OLS, HAC (Newey-West, 5 lags) 95% CIs, returns in %. Read: 1% factor move -> beta % Nifty move.
Target: Nifty open gap ln(O_t/C_t-1)
Factor (known pre-open)
Beta [95% HAC CI]
R² alone
p
Hang Seng open gap (t)
+0.422 [+0.366, +0.478]
0.326
2.99e-49
S&P 500
+0.295 [+0.251, +0.338]
0.247
4.96e-40
Dow (prev US session)
+0.292 [+0.243, +0.341]
0.231
4.91e-32
Nasdaq
+0.230 [+0.201, +0.259]
0.222
2.63e-55
Nikkei open gap (t)
+0.346 [+0.307, +0.385]
0.178
6.38e-68
US VIX
-0.032 [-0.036, -0.028]
0.165
7.15e-53
DXY
-0.234 [-0.301, -0.167]
0.027
8.8e-12
Brent (to last settle)
+0.025 [+0.007, +0.043]
0.010
0.00521
WTI
+0.019 [-0.002, +0.040]
0.008
0.0788
Gold
+0.045 [+0.015, +0.075]
0.006
0.00356
India VIX chg (t-1)
-0.004 [-0.010, +0.003]
0.001
0.261
Nifty ret (t-1)
+0.014 [-0.039, +0.068]
0.001
0.605
USDINR (prev day)
+0.025 [-0.040, +0.090]
0.000
0.457
US10Y (bp)
-0.001 [-0.006, +0.005]
0.000
0.795
Target: Nifty close-to-close
Factor (known pre-open)
Beta [95% HAC CI]
R² alone
p
Hang Seng open gap (t)
+0.460 [+0.372, +0.549]
0.140
2.31e-24
S&P 500
+0.275 [+0.180, +0.371]
0.078
1.7e-08
Dow (prev US session)
+0.276 [+0.173, +0.380]
0.075
1.78e-07
Nasdaq
+0.218 [+0.155, +0.280]
0.072
1.04e-11
Nikkei open gap (t)
+0.344 [+0.289, +0.398]
0.064
4.58e-35
US VIX
-0.029 [-0.035, -0.023]
0.050
2.43e-23
DXY
-0.205 [-0.296, -0.115]
0.007
8.48e-06
Gold
+0.053 [+0.012, +0.094]
0.003
0.0117
WTI
+0.019 [-0.012, +0.051]
0.003
0.23
Brent (to last settle)
+0.019 [-0.006, +0.044]
0.002
0.139
US10Y (bp)
-0.006 [-0.015, +0.002]
0.001
0.16
Nifty ret (t-1)
-0.009 [-0.066, +0.048]
0.000
0.762
India VIX chg (t-1)
-0.001 [-0.009, +0.007]
0.000
0.805
USDINR (prev day)
+0.001 [-0.115, +0.118]
0.000
0.982
2. Multivariate forecasting models (B)
OLS on 11 core pre-open factors, HAC SEs. Gap R²=0.398, close-to-close R²=0.162, open-to-close R²=0.0068 (in-sample, n=3593). Std beta = SD of target per SD of factor. Ridge/Lasso/ElasticNet (CV, TimeSeriesSplit) shown as markers on the chart use the full 23-factor set.
Open gap (R²=0.398)
Factor
Raw beta [95% HAC CI]
Std beta
p
Hang Seng open gap (t)
+0.287 [+0.217, +0.358]
+0.388
1.61e-15***
Dow (prev US session)
+0.148 [+0.094, +0.202]
+0.244
7.74e-08***
Nikkei open gap (t)
+0.078 [+0.032, +0.124]
+0.095
0.000847***
Nifty ret (t-1)
-0.048 [-0.103, +0.006]
-0.080
0.0831
US10Y (bp)
-0.007 [-0.012, -0.003]
-0.060
0.00176**
DXY
-0.074 [-0.129, -0.019]
-0.052
0.00796**
US VIX
-0.002 [-0.008, +0.003]
-0.031
0.4
USDINR (prev day)
+0.024 [-0.029, +0.076]
+0.016
0.375
Brent (to last settle)
-0.002 [-0.015, +0.010]
-0.009
0.711
Gold
+0.001 [-0.022, +0.023]
+0.002
0.936
India VIX chg (t-1)
+0.000 [-0.008, +0.008]
+0.001
0.971
Open gap, excluding Covid crash 15-Feb..31-May-2020 (R²=0.407)
Factor
Raw beta [95% HAC CI]
Std beta
p
Hang Seng open gap (t)
+0.230 [+0.192, +0.269]
+0.347
1.67e-31***
Dow (prev US session)
+0.114 [+0.083, +0.145]
+0.188
5.81e-13***
Nikkei open gap (t)
+0.102 [+0.072, +0.133]
+0.142
6.58e-11***
US VIX
-0.006 [-0.010, -0.003]
-0.094
0.000251***
DXY
-0.096 [-0.140, -0.052]
-0.076
2.13e-05***
India VIX chg (t-1)
+0.007 [+0.003, +0.011]
+0.069
0.000576***
US10Y (bp)
-0.006 [-0.010, -0.002]
-0.056
0.00163**
Brent (to last settle)
-0.010 [-0.020, -0.000]
-0.043
0.0429*
Nifty ret (t-1)
+0.008 [-0.016, +0.032]
+0.014
0.502
Gold
-0.004 [-0.023, +0.015]
-0.008
0.687
USDINR (prev day)
+0.006 [-0.029, +0.041]
+0.005
0.738
Close-to-close (R²=0.162)
Factor
Raw beta [95% HAC CI]
Std beta
p
Hang Seng open gap (t)
+0.362 [+0.255, +0.469]
+0.295
3.72e-11***
Dow (prev US session)
+0.141 [-0.018, +0.301]
+0.141
0.0827
Nifty ret (t-1)
-0.066 [-0.143, +0.011]
-0.066
0.0909
US10Y (bp)
-0.012 [-0.020, -0.004]
-0.061
0.00303**
Nikkei open gap (t)
+0.074 [-0.023, +0.170]
+0.054
0.133
US VIX
+0.002 [-0.011, +0.015]
+0.015
0.767
Brent (to last settle)
-0.005 [-0.026, +0.015]
-0.013
0.599
Gold
+0.008 [-0.031, +0.048]
+0.009
0.679
India VIX chg (t-1)
+0.000 [-0.010, +0.011]
+0.000
0.986
USDINR (prev day)
+0.001 [-0.104, +0.106]
+0.000
0.99
DXY
-0.000 [-0.108, +0.108]
-0.000
1
Open-to-close (R²=0.0068)
Factor
Raw beta [95% HAC CI]
Std beta
p
Hang Seng open gap (t)
+0.074 [+0.006, +0.142]
+0.074
0.0322*
US VIX
+0.004 [-0.006, +0.015]
+0.041
0.406
DXY
+0.074 [-0.017, +0.165]
+0.038
0.111
US10Y (bp)
-0.005 [-0.011, +0.002]
-0.030
0.151
Nifty ret (t-1)
-0.018 [-0.067, +0.031]
-0.022
0.477
USDINR (prev day)
-0.023 [-0.123, +0.077]
-0.012
0.653
Gold
+0.007 [-0.031, +0.046]
+0.010
0.703
Brent (to last settle)
-0.003 [-0.020, +0.014]
-0.009
0.714
Dow (prev US session)
-0.007 [-0.134, +0.120]
-0.008
0.917
Nikkei open gap (t)
-0.005 [-0.077, +0.068]
-0.004
0.902
India VIX chg (t-1)
-0.000 [-0.008, +0.008]
-0.000
0.99
3. Explanatory / attribution framing (A) - concurrent, NOT forecasts
A1: Nifty daily return on same-day sector index returns. Sectors are Nifty constituents, so this is near-mechanical attribution (R²=0.965). A2: mixed-timing macro explanation (same-day India VIX, USDINR, Asia closes; prior-session US), R²=0.393.
A1 sector attribution, core-8 (R²=0.965)
Factor
Raw beta [95% HAC CI]
Std beta
p
BANK (same day)
+0.349 [+0.337, +0.362]
+0.484
0***
IT (same day)
+0.163 [+0.155, +0.170]
+0.215
0***
ENERGY (same day)
+0.154 [+0.144, +0.164]
+0.197
3.4e-191***
FMCG (same day)
+0.148 [+0.138, +0.157]
+0.151
7.38e-220***
AUTO (same day)
+0.105 [+0.096, +0.115]
+0.138
2.44e-97***
METAL (same day)
+0.032 [+0.025, +0.039]
+0.055
2.66e-21***
PHARMA (same day)
+0.040 [+0.033, +0.048]
+0.046
1.57e-24***
REALTY (same day)
-0.003 [-0.008, +0.003]
-0.005
0.337
A1 full-12 incl. Fin Services, PSU Bank, Infra, Media (R²=0.984; collinear - see VIF)
Factor
Raw beta [95% HAC CI]
Std beta
p
FIN (same day)
+0.329 [+0.312, +0.347]
+0.436
6.32e-293***
IT (same day)
+0.151 [+0.146, +0.156]
+0.199
0***
INFRA (same day)
+0.125 [+0.114, +0.136]
+0.151
1.21e-108***
ENERGY (same day)
+0.111 [+0.102, +0.120]
+0.141
5.25e-134***
FMCG (same day)
+0.125 [+0.119, +0.130]
+0.127
0***
AUTO (same day)
+0.081 [+0.075, +0.087]
+0.106
1.9e-136***
BANK (same day)
+0.060 [+0.043, +0.076]
+0.083
1.16e-12***
PSUBANK (same day)
-0.024 [-0.028, -0.019]
-0.047
3.9e-25***
METAL (same day)
+0.028 [+0.023, +0.032]
+0.047
3.52e-32***
PHARMA (same day)
+0.036 [+0.031, +0.041]
+0.041
3.46e-45***
REALTY (same day)
-0.016 [-0.019, -0.012]
-0.030
3.89e-16***
MEDIA (same day)
-0.006 [-0.010, -0.002]
-0.010
0.00423**
Sector univariate fit
Sector (same day)
Univariate beta
R² alone
corr
FIN
0.687
0.828
0.910
BANK
0.637
0.784
0.885
INFRA
0.713
0.748
0.865
AUTO
0.606
0.634
0.796
ENERGY
0.602
0.590
0.768
METAL
0.415
0.503
0.709
REALTY
0.354
0.469
0.685
PSUBANK
0.329
0.434
0.659
FMCG
0.625
0.408
0.639
MEDIA
0.348
0.323
0.568
IT
0.420
0.307
0.554
PHARMA
0.458
0.274
0.523
A2 macro explanatory (R²=0.393)
Factor
Raw beta [95% HAC CI]
Std beta
p
India VIX chg (same day)
-0.086 [-0.095, -0.077]
-0.443
1.57e-75***
Hang Seng (same day)
+0.161 [+0.102, +0.220]
+0.206
9.8e-08***
Dow (prev US session)
+0.123 [-0.018, +0.265]
+0.123
0.0877
Nikkei (same day)
+0.085 [+0.051, +0.119]
+0.113
8.61e-07***
US VIX
+0.009 [-0.002, +0.021]
+0.073
0.119
USDINR (same day)
-0.120 [-0.216, -0.025]
-0.051
0.0136*
US10Y (bp)
-0.009 [-0.015, -0.004]
-0.048
0.00134**
Brent (to last settle)
+0.002 [-0.013, +0.017]
+0.004
0.811
Gold
-0.003 [-0.036, +0.031]
-0.003
0.871
DXY
+0.004 [-0.089, +0.096]
+0.002
0.936
4. Out-of-sample: train 2012-2022, frozen, tested once on 2023-01-01..2026-10-09
OOS R² = 1 - SSE(model)/SSE(train-mean forecast) (Campbell-Thompson). Hit rate = sign agreement; Wilson 95% CI. DM = Diebold-Mariano test of squared errors vs train-mean (HAC).
Open gap
Model
OOS R² (vs train mean)
RMSE %
Hit rate [Wilson 95%]
DM p vs mean
Baseline: zero
-0.005
0.533
Baseline: train mean
+0.000
0.531
61.0% [57.8%, 64.1%]
Baseline: prev-day same target
-1.125
0.774
54.2% [51.0%, 57.4%]
Baseline: always up
61.0% [57.8%, 64.1%]
1-factor Dow beta (train)
+0.239
0.463
70.0% [67.0%, 72.9%]
0.000
OLS core
+0.329
0.435
71.6% [68.6%, 74.4%]
0.012
Ridge (full)
+0.323
0.437
72.0% [69.0%, 74.8%]
0.011
Lasso (full)
+0.328
0.435
72.5% [69.5%, 75.3%]
0.011
ElasticNet (full)
+0.336
0.433
72.5% [69.5%, 75.3%]
0.008
GBM (full)
+0.344
0.430
72.7% [69.7%, 75.5%]
0.002
Open gap, US/macro only (no Asia opens)
Model
OOS R² (vs train mean)
RMSE %
Hit rate [Wilson 95%]
DM p vs mean
Baseline: zero
-0.005
0.533
Baseline: train mean
+0.000
0.531
61.0% [57.8%, 64.1%]
Baseline: prev-day same target
-1.125
0.774
54.2% [51.0%, 57.4%]
Baseline: always up
61.0% [57.8%, 64.1%]
1-factor Dow beta (train)
+0.239
0.463
70.0% [67.0%, 72.9%]
0.000
OLS core
+0.254
0.459
70.1% [67.1%, 73.0%]
0.001
Ridge (full)
+0.259
0.457
71.3% [68.3%, 74.1%]
0.001
Lasso (full)
+0.249
0.460
70.8% [67.7%, 73.6%]
0.002
ElasticNet (full)
+0.253
0.459
71.1% [68.1%, 73.9%]
0.001
GBM (full)
+0.248
0.461
70.7% [67.6%, 73.5%]
0.003
Close-to-close
Model
OOS R² (vs train mean)
RMSE %
Hit rate [Wilson 95%]
DM p vs mean
Baseline: zero
+0.000
0.796
Baseline: train mean
+0.000
0.797
53.2% [49.9%, 56.4%]
Baseline: prev-day same target
-1.100
1.154
53.1% [49.9%, 56.3%]
Baseline: always up
53.2% [49.9%, 56.4%]
1-factor Dow beta (train)
+0.087
0.761
59.6% [56.4%, 62.7%]
0.004
OLS core
+0.055
0.775
58.8% [55.6%, 61.9%]
0.312
Ridge (full)
+0.087
0.761
59.6% [56.4%, 62.7%]
0.081
Lasso (full)
+0.087
0.761
58.5% [55.3%, 61.6%]
0.085
ElasticNet (full)
+0.087
0.761
58.5% [55.3%, 61.6%]
0.083
GBM (full)
+0.063
0.771
60.1% [56.9%, 63.2%]
0.158
Open-to-close (pre-open info)
Model
OOS R² (vs train mean)
RMSE %
Hit rate [Wilson 95%]
DM p vs mean
Baseline: zero
-0.003
0.636
Baseline: train mean
+0.000
0.635
52.9% [49.7%, 56.1%]
Baseline: prev-day same target
-1.225
0.947
47.5% [44.3%, 50.7%]
Baseline: always up
47.1% [43.9%, 50.3%]
1-factor Dow beta (train)
+0.001
0.634
53.0% [49.8%, 56.2%]
0.370
OLS core
-0.045
0.649
53.7% [50.5%, 56.9%]
0.005
Ridge (full)
+0.002
0.634
52.8% [49.6%, 56.0%]
0.411
Lasso (full)
-0.000
0.635
52.9% [49.7%, 56.1%]
0.185
ElasticNet (full)
-0.000
0.635
52.9% [49.7%, 56.1%]
0.185
GBM (full)
-0.052
0.651
49.9% [46.7%, 53.1%]
0.008
Open-to-close, also using the realised gap at 09:15
Model
OOS R² (vs train mean)
RMSE %
Hit rate [Wilson 95%]
DM p vs mean
Baseline: zero
-0.003
0.636
Baseline: train mean
+0.000
0.635
52.9% [49.7%, 56.1%]
Baseline: prev-day same target
-1.225
0.947
47.5% [44.3%, 50.7%]
Baseline: always up
47.1% [43.9%, 50.3%]
1-factor Dow beta (train)
+0.001
0.634
53.0% [49.8%, 56.2%]
0.370
OLS core
-0.049
0.650
52.0% [48.7%, 55.2%]
0.005
Ridge (full)
+0.003
0.634
53.2% [49.9%, 56.4%]
0.221
Lasso (full)
-0.000
0.635
52.9% [49.7%, 56.1%]
0.185
ElasticNet (full)
-0.000
0.635
52.9% [49.7%, 56.1%]
0.185
GBM (full)
-0.053
0.651
51.4% [48.2%, 54.6%]
0.004
5. Walk-forward (expanding window, refit every 1 Jan, predict that year, 2016-2026)
Pooled 2016-2026
Target
Model
OOS R²
Hit rate [Wilson 95%]
n
gap
OLS core
+0.344
74.8% [73.1%, 76.4%]
2620
gap
Ridge (full)
+0.347
75.0% [73.3%, 76.6%]
2620
gap
ElasticNet (full)
+0.337
75.7% [74.0%, 77.3%]
2620
gap
GBM (full)
+0.318
76.1% [74.5%, 77.7%]
2620
gap
Baseline: train mean
+0.000
66.7% [64.9%, 68.5%]
2620
oc
OLS core
-0.021
53.9% [51.9%, 55.8%]
2620
oc
Ridge (full)
-0.002
52.9% [51.0%, 54.8%]
2620
oc
ElasticNet (full)
+0.000
52.7% [50.8%, 54.7%]
2620
oc
GBM (full)
-0.036
51.6% [49.7%, 53.5%]
2620
oc
Baseline: train mean
+0.000
53.2% [51.3%, 55.1%]
2620
cc
OLS core
+0.127
62.1% [60.2%, 63.9%]
2620
cc
Ridge (full)
+0.140
62.4% [60.6%, 64.3%]
2620
cc
ElasticNet (full)
+0.150
62.4% [60.5%, 64.2%]
2620
cc
GBM (full)
+0.110
63.0% [61.1%, 64.8%]
2620
cc
Baseline: train mean
+0.000
53.9% [52.0%, 55.8%]
2620
oc_atopen
OLS core
-0.024
53.5% [51.6%, 55.5%]
2620
oc_atopen
Ridge (full)
-0.001
53.4% [51.5%, 55.3%]
2620
oc_atopen
ElasticNet (full)
+0.001
53.0% [51.1%, 54.9%]
2620
oc_atopen
GBM (full)
-0.031
52.1% [50.2%, 54.0%]
2620
oc_atopen
Baseline: train mean
+0.000
53.2% [51.3%, 55.1%]
2620
Ridge OOS R² by year
spec
year
cc
gap
oc
oc_atopen
2016
+0.212
+0.215
+0.005
+0.005
2017
+0.158
+0.254
+0.006
+0.017
2018
+0.172
+0.533
-0.027
-0.013
2019
-0.010
-0.198
-0.011
-0.021
2020
+0.173
+0.364
-0.003
-0.003
2021
+0.123
+0.359
+0.003
+0.002
2022
+0.147
+0.465
-0.000
+0.000
2023
-0.077
-0.063
-0.004
-0.005
2024
+0.034
+0.221
+0.004
+0.004
2025
+0.062
+0.430
+0.001
+0.003
2026
+0.289
+0.411
+0.010
+0.013
6. Stability: rolling and calendar-year betas
Rolling 252-day multivariate betas and per-year univariate betas. Betas drift a lot; the Dow->gap link is the most stable.
Calendar-year univariate betas
year
target
factor
2012
2013
2014
2015
2016
2017
2018
2019
2020
2021
2022
2023
2024
2025
2026
cc
BRENT_pre
-0.04
+0.08
+0.10
+0.00
+0.06
-0.01
-0.02
-0.04
+0.06
+0.04
-0.01
+0.03
+0.08
+0.03
-0.04
cc
DOW_pre
+0.26
+0.40
+0.43
+0.29
+0.34
+0.30
+0.18
-0.00
+0.29
+0.18
+0.34
+0.31
+0.32
+0.19
+0.40
cc
USDINR_same
-0.03
-0.19
-0.34
-0.73
-0.81
-0.29
-0.27
-0.16
-0.65
-0.43
-0.56
-0.06
+0.30
-0.25
-0.56
gap
BRENT_pre
+0.11
+0.07
+0.02
+0.03
+0.06
+0.00
+0.01
+0.01
+0.07
+0.04
-0.02
+0.01
+0.01
+0.04
-0.05
gap
DOW_pre
+0.40
+0.40
+0.34
+0.25
+0.23
+0.28
+0.28
+0.06
+0.27
+0.26
+0.40
+0.27
+0.30
+0.28
+0.45
gap
HSI_gapopen
+0.53
+0.57
+0.38
+0.41
+0.36
+0.40
+0.42
+0.16
+0.81
+0.37
+0.36
+0.18
+0.21
+0.34
+0.67
7. Tails: quantile regression (10% / 50% / 90%)
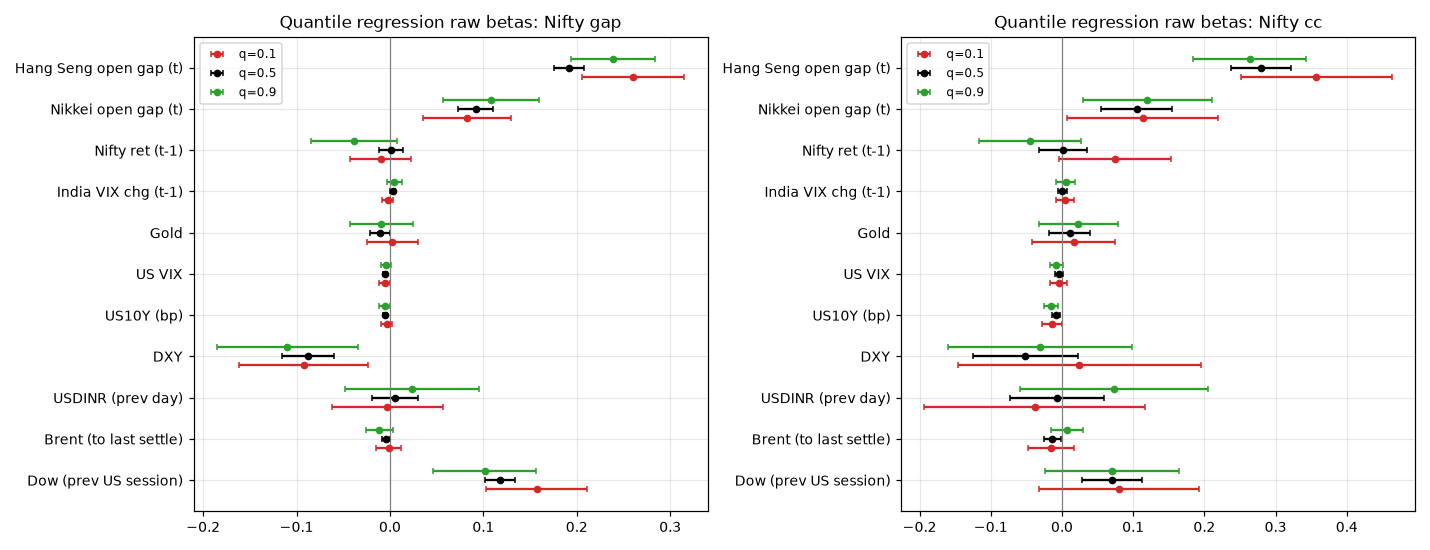
Raw betas with 95% CIs. Dow and Hang Seng sensitivities are larger in the bad tail (q=0.1) of the gap distribution.
ymf_ovn = YM=F move from the 16:00 ET cash-close bar to the last hourly bar ending ≤ 08:30 IST on Nifty day t.
Gap regressions
Model
Factor
Beta [95% CI]
R²
n
Dow cash only
DOW_pre
+0.330 [+0.239, +0.421]
0.231
593
Dow fut overnight only
ymf_ovn
+0.682 [+0.425, +0.938]
0.170
593
Dow cash + fut overnight
DOW_pre
+0.310 [+0.235, +0.384]
0.372
593
Dow cash + fut overnight
ymf_ovn
+0.623 [+0.406, +0.840]
0.372
593
+ Asia open gaps + Brent + USDINR
DOW_pre
+0.193 [+0.128, +0.258]
0.474
593
+ Asia open gaps + Brent + USDINR
ymf_ovn
+0.448 [+0.286, +0.609]
0.474
593
+ Asia open gaps + Brent + USDINR
NIKKEI_gapopen
+0.072 [+0.006, +0.138]
0.474
593
+ Asia open gaps + Brent + USDINR
HSI_gapopen
+0.219 [+0.152, +0.285]
0.474
593
+ Asia open gaps + Brent + USDINR
BRENT_pre
-0.011 [-0.035, +0.013]
0.474
593
+ Asia open gaps + Brent + USDINR
USDINR_pre
+0.116 [+0.028, +0.204]
0.474
593
10. Multicollinearity (VIF)
VIF > 10 = severe. S&P/Dow/Nasdaq/Dow-futures and Brent/WTI are near-duplicates; Bank vs Fin Services too. That is why the 'core' OLS keeps one of each and the full set is only used in regularised/GBM models.
Regressing log Nifty on log Dow gives R² ≈ 0.96 with Durbin-Watson ≈ 0.02 - textbook spurious regression. All log levels are I(1) (ADF), returns are stationary. Engle-Granger does not find robust cointegration (Nifty-USDINR p≈0.03 is marginal and driven by common trends; multivariate p≈0.6). Conclusion: model returns, not levels.
Levels / ADF / EG
pair
level_beta
level_r2
durbin_watson
eg_stat
eg_p
ln NIFTY ~ ln DOW
1.2130
0.9636
0.0205
-2.7376
0.1864
ln NIFTY ~ ln BRENT
-0.0320
0.0004
0.0004
-1.1087
0.8802
ln NIFTY ~ ln USDINR
3.0420
0.8877
0.0129
-3.5419
0.0289
ln NIFTY ~ ln DOW + ln BRENT + ln USDINR
0.9661
0.0204
-2.6463
0.6007
ADF ln NIFTY (level)
-1.1798
0.6822
ADF dln NIFTY (returns)
-16.8260
0.0000
ADF ln DOW (level)
-0.7448
0.8348
ADF dln DOW (returns)
-18.9464
0.0000
ADF ln BRENT (level)
-2.6633
0.0806
ADF dln BRENT (returns)
-10.9417
0.0000
ADF ln USDINR (level)
-0.7501
0.8333
ADF dln USDINR (returns)
-26.8975
0.0000
12. Granger causality (native-date daily returns, common days)
Lag-1 US return = the overnight session for India. Dow strongly Granger-causes Nifty; Brent weakly; USDINR does not. Nifty Granger-causes USDINR (equity flows move the rupee).