Does Nifty's last 30 minutes (15:00–15:30) predict the next day? Full-history backtest for an option buyer
Built 2026-10-21 16:59 IST. Research only, not advice. Data: Nifty 50 1-min spot (Upstox) 2022-01-03 → 2026-10-21; Nifty weekly options 1-min (Upstox, S3 analyticsdata123) Aug 2024 → Sep 2026.
Plain-language summary
Verdict: FAIL — not a tradeable option-buyer rule after costs. The last 30 minutes (15:00–15:30) of Nifty do not reliably predict the next day's gap or first hour.
- Day before expiry + large late move: FAIL. No spot result survives multiple-testing correction; no option variant reaches 20 trades; only 75 of 1728 stay positive without their single best day. Details and day list.
- Data note (frozen closing window): since NSE's closing auction began (2026-08-03), Upstox flat-fills the index from 15:15 to the close (54/54 Nifty sessions). Re-run with real prices only: verdict unchanged (FAIL), numbers change by only a few points. Today (21 Oct) is pending Upstox historical data. details.
- Data: all 1167 usable sessions from 2022-01-04 to 2026-10-19 (signal days; next day up to 2026-10-21), Nifty 1-minute spot. Every day used, not just big-move days. No Nifty intraday history before 2022 exists on the box, in S3 analyticsdata123, or via the Upstox API (it returns nothing before Jan 2022), so this is the longest available sample.
- Overall link is ~zero: rank correlation of last30 with next-day gap = -0.011 (permutation p=0.72); with 10:15 vs previous close = -0.025 (p=0.37). Nifty gaps up 59.6% of all days whatever the last 30 minutes did.
- Today (21 Oct 2026): last30 = +0.57% (14:59 22,683.15 → 15:29 22,811.35; you measured +0.61% from the 15:00 bar) falls in the >0.5% bucket, on a down day (-0.34%). Full history for that bucket: n=20, gap up 75% (base 60%, p=0.18), above previous close at 10:15 55% (base 55%), next close up 70%. From 09:20 to 10:15 it was up only 40%. Only 20 cases and not significant. Caveat: about 0.32% of today's move came in the single 15:29 closing-print bar. Without that bar, today is +0.24%, which is the 0.1..0.3 bucket (n=229, gap up 59%, 10:15 up 56%), basically the base rate.
- Big late sell-off (fade idea): -0.5 to -0.3%: n=52, gap up 73% vs base 60% (binomial p=0.049, shuffle p=0.064). Below -0.5%: n=12, gap up 58%. The gap bounce is real-ish but does not carry: from 09:20 to 10:15 these days went up only 44% of the time. In other words, the bounce is spent at the open, before an option buyer can get in. It is also weaker in 2024–26 (gap up 63% vs a 57% base) than in 2022–23 (76% vs 64%).
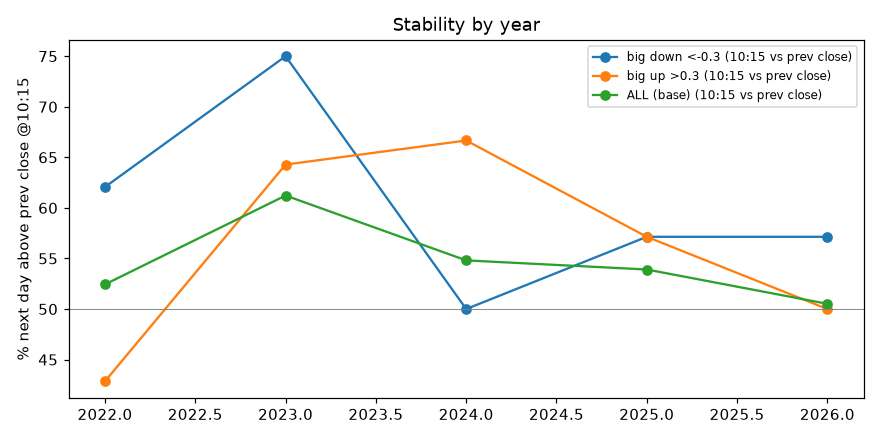
- Stable by year? No. The big-up and big-down buckets flip around the base from year to year. Correlations by year range from −0.12 to +0.06. Nothing that looked good in 2022–23 holds up in 2024–26 (all 2024–26 bucket p-values ≥ 0.21).
- Option-buyer P&L (Aug 2024–Sep 2026, 507 next-day sessions with 1-minute ATM option data): 12 of 960 rule variants made money after 3 pts slippage per leg plus brokerage and taxes, and all of those had only 3–4 trades. None beat 95% of random same-size entry sets (best percentile 94). Headline X=0.3%, 09:20 entry, 10:15 exit: momentum -743 pts over 42 trades; fade -45 pts; buying a CE after a big drop -209 pts. Buying an ATM CE or PE every day at 09:20 loses about 7–10 pts a trade after costs, and the last30 filter does not improve on that.
- Does the 15:29 bar matter? For the statistics, barely: with and without that bar, last30 correlates 0.92–0.99. It does matter more in 2026, where 15% of days change bucket and the 90th-percentile 15:29 jump is 0.09% (about 0.05% in earlier years). Today is a clear example. Excluding the bar does not create an edge either.
- What does carry over (side note, not a rule): the whole-day direction. When last30 is flat, an up day is followed by a gap up 67% of the time vs 50% after a down day. In a regression, day trend has t=2.6 for the gap while last30 has t=-0.4. That edge is in the gap, which a 09:20 option buyer cannot capture.
- Practical takeaway for your first-hour with-trend style: do not pre-commit a direction from the last 30 minutes. Keep reading the first 5–15 minutes of the next session. last30 adds nothing measurable on top of that.
- Day before expiry (section): on the 250 pre-expiry days, last30 tends to reverse at the gap (gap followed last30 39% vs 52%, p=0.016, nominal) but not after 09:20. Day-direction carry vanishes. Still FAIL. Tomorrow (2026-10-22) is not a pre-expiry day.
Data note: frozen closing window (added 2026-10-21) and corrected numbers
What happened: NSE's Closing Auction Session (CAS) went live in the cash market on 2026-08-03. For F&O stocks, continuous trading ends at 15:15, the auction runs 15:15–15:30 (random close 15:28–15:30), and the official close comes from the auction. The Nifty/Sensex spot value therefore stops moving at 15:15. Upstox (historical and live) fills 15:15–15:27/15:28 with flat O=H=L=C bars, then one bar jumps to the closing print. Those flat bars are not trades. Index options and futures keep trading until 15:40, and their bars are real: on 14 frozen days checked, near-ATM option bars from 15:15 to 15:29 had 0% flat repeats and normal volume.
Scope (Upstox HISTORICAL candles only): Nifty, 54 of 54 sessions from 2026-08-03 to 2026-10-19 (0 before Aug 2026); the last real minute is 15:14 on every one, and the closing print equals the Upstox daily close on all 54. Sensex: 53 of 53 post-Aug sessions (2 print/daily mismatches). Also, Nifty 2022-03-07 09:37–10:21 had flat-filled morning bars, now marked missing. The earlier "26 days" count missed the variant where the jump lands in the 15:28 bar. 2026-10-21 (today) is pending: Upstox has not published historical candles for it yet, intraday-feed bars are not used, and it will be added when historical data is available.
Rule applied (helper /workspace/research/common/clean_close_window.py): frozen and closing-print bars are set MISSING, never filled. last30 = last REAL close / 14:59 close (15:29 on normal days, 15:14 on frozen days). A separate variant runs to the Upstox daily (official) close. Any day missing a needed bar is excluded. For 15:20/15:25/15:28 option entries, the signal and ATM strike use the last real index bar at or before entry (15:14 on frozen days). Option entry bars are checked for flat-fill (none found). Results are also shown with all frozen days excluded.
Verdict unchanged: FAIL. On the cleaned data (n=1165 days), last30 still has no link to the next-day gap or first hour against the last real close (ρ=+0.002, p=0.94). Today's bucket (>+0.5%): n=18, gap up 78%, 10:15 up 61%, 09:20→10:15 up 44%. Today itself is pending historical data.
Reference-price warning: against the official close, last30 suddenly correlates with the gap (ρ=+0.112, p<0.001). That is mechanical, not an edge. Before CAS the official close was a VWAP of the last 30 minutes, so after a late rally the last traded price sits above the official close and the next open "gaps up" relative to it. Nobody can trade at the official close, and an option buyer's entry price already reflects the last traded price. From 09:20 the two references give the same answer.
Bucket table: previous run vs cleaned data
| bucket | n old | n clean | gap up % old | gap up % clean | p gap clean | 10:15 up % old | 10:15 up % clean | 09:20→10:15 up % old | 09:20→10:15 up % clean | gap up % vs OFFICIAL close | p (official ref) |
|---|
| <-0.5 | 12 | 12 | 58.3 | 58.3 | 1.000 | 50.0 | 50.0 | 41.7 | 41.7 | 58.3 | 1.000 |
| -0.5..-0.3 | 52 | 51 | 73.1 | 72.5 | 0.085 | 63.5 | 64.7 | 44.2 | 45.1 | 66.7 | 0.474 |
| -0.3..-0.1 | 231 | 224 | 58.4 | 58.5 | 0.682 | 56.3 | 56.2 | 49.4 | 50.0 | 54.9 | 0.075 |
| -0.1..0.1 | 567 | 593 | 59.3 | 59.4 | 0.769 | 52.9 | 52.8 | 51.0 | 51.3 | 59.5 | 0.501 |
| 0.1..0.3 | 241 | 227 | 59.8 | 61.2 | 0.735 | 56.0 | 57.3 | 53.1 | 52.0 | 67.4 | 0.048 |
| 0.3..0.5 | 44 | 40 | 47.7 | 47.5 | 0.110 | 54.5 | 55.0 | 65.9 | 65.0 | 62.5 | 0.873 |
| >0.5 | 20 | 18 | 75.0 | 77.8 | 0.152 | 55.0 | 61.1 | 40.0 | 44.4 | 83.3 | 0.056 |
Correlation of last30 with the next day
| next-day measure | ρ old | ρ clean (vs last real close) | perm p clean | ρ vs OFFICIAL close | perm p official |
|---|
| n_gap | -0.011 | 0.002 | 0.938 | 0.112 | 0.000 |
| n_0930 | -0.038 | -0.022 | 0.476 | 0.071 | 0.018 |
| n_0945 | -0.035 | -0.024 | 0.419 | 0.065 | 0.028 |
| n_1015 | -0.025 | -0.017 | 0.565 | 0.065 | 0.029 |
| n_1115 | -0.014 | -0.005 | 0.856 | 0.066 | 0.025 |
| n_close | 0.021 | 0.025 | 0.420 | 0.085 | 0.004 |
| n_from0920_0945 | 0.036 | 0.024 | 0.416 | 0.024 | 0.416 |
| n_from0920_1015 | 0.062 | 0.049 | 0.085 | 0.049 | 0.085 |
| n_from0920_1115 | 0.047 | 0.040 | 0.176 | 0.040 | 0.176 |
| n_from0920_close | 0.084 | 0.076 | 0.009 | 0.076 | 0.009 |
Option-buyer P&L (next-day 09:16/09:20 entries)
| run | variants | positive | pos_n20 | beat95 | best_pct |
|---|
| previous | 960 | 12 | 0 | 0 | 94.2 |
| clean | 960 | 33 | 7 | 2 | 96.2 |
| mode | trades old | win_pct old | avg_pts old | total_pts old | pctile_vs_random old | trades clean | win_pct clean | avg_pts clean | total_pts clean | pctile_vs_random clean |
|---|
| momentum | 42 | 28.6 | -17.7 | -742.8 | 4.9 | 36 | 30.6 | -20.0 | -719.0 | 2.9 |
| fade | 42 | 45.2 | -1.1 | -45.5 | 91.4 | 36 | 47.2 | 0.1 | 4.8 | 93.0 |
| fade_drop_only(CE) | 23 | 43.5 | -9.1 | -209.2 | 58.2 | 22 | 45.5 | -7.9 | -173.1 | 63.6 |
| momo_up_only(CE) | 19 | 10.5 | -25.5 | -483.6 | 3.0 | 14 | 14.3 | -31.4 | -439.9 | 1.3 |
| momo_drop_only(PE) | 23 | 43.5 | -11.3 | -259.2 | 29.6 | 22 | 40.9 | -12.7 | -279.1 | 22.6 |
Clean CSVs: clean_buckets_last30.csv, clean_officialref_buckets_last30.csv, clean_option_pnl_summary.csv, nifty_frozen_days.csv, sensex_frozen_days.csv.
Day-before-expiry check on cleaned data: gap follows last30 direction (pre-expiry vs other days)
| h | n_pre old | %up_pre old | n_other old | %up_other old | p old | n_pre clean | %up_pre clean | n_other clean | %up_other clean | p clean |
|---|
| n_gap | 127.0 | 39.4 | 473.0 | 51.8 | 0.016 | 121.0 | 39.7 | 451.0 | 52.3 | 0.014 |
| n_1015 | 127.0 | 44.1 | 473.0 | 50.7 | 0.195 | 121.0 | 44.6 | 451.0 | 51.2 | 0.220 |
| n_from0920_1015 | 127.0 | 55.9 | 473.0 | 52.2 | 0.484 | 121.0 | 56.2 | 451.0 | 51.2 | 0.357 |
Same conclusion: a nominal reversal at the gap before expiry that fails multiple-testing correction and is gone by 09:20.
1. Bucket table: all 1167 days (last30 = close 15:29 / close 14:59 − 1)
"up %" = % of next days where the price at that time is above the signal day's close (the 09:15 open for "gap"). "same-dir" = moved in the same direction as last30. p = two-sided binomial test vs the all-days base rate (7 buckets × several horizons are tested, so p≈0.05 is expected by chance a few times). "09:20→10:15" is what an option buyer entering at 09:20 actually gets.
| last30 bucket % | n | gap up % | gap same-dir % | gap med % | 09:30 up % | 09:45 up % | 10:15 up % | 11:15 up % | close up % | 10:15 med % | close med % | 09:20→10:15 up % | p gap (binom) | p 10:15 | p 09:20→10:15 |
|---|
| <-0.5 | 12 | 58.33 | 41.67 | 0.24 | 50.00 | 50.00 | 50.00 | 41.67 | 50.00 | -0.04 | 0.07 | 41.67 | 1.00 | 0.78 | 0.57 |
| -0.5..-0.3 | 52 | 73.08 | 26.92 | 0.23 | 71.15 | 67.31 | 63.46 | 61.54 | 48.08 | 0.23 | -0.05 | 44.23 | 0.05 | 0.21 | 0.34 |
| -0.3..-0.1 | 231 | 58.44 | 41.56 | 0.08 | 53.25 | 53.25 | 56.28 | 53.68 | 50.22 | 0.06 | 0.04 | 49.35 | 0.74 | 0.69 | 0.65 |
| -0.1..0.1 | 567 | 59.26 | 51.68 | 0.09 | 56.79 | 54.67 | 52.91 | 53.79 | 51.15 | 0.03 | 0.02 | 50.97 | 0.86 | 0.38 | 0.97 |
| 0.1..0.3 | 241 | 59.75 | 59.75 | 0.09 | 52.70 | 55.60 | 56.02 | 54.36 | 49.79 | 0.06 | -0.01 | 53.11 | 1.00 | 0.75 | 0.56 |
| 0.3..0.5 | 44 | 47.73 | 47.73 | -0.02 | 50.00 | 54.55 | 54.55 | 47.73 | 54.55 | 0.06 | 0.09 | 65.91 | 0.12 | 1.00 | 0.05 |
| >0.5 | 20 | 75.00 | 75.00 | 0.17 | 65.00 | 70.00 | 55.00 | 60.00 | 70.00 | 0.13 | 0.16 | 40.00 | 0.18 | 1.00 | 0.38 |
| ALL (base rate) | 1167 | 59.64 | | 0.09 | 55.70 | 55.36 | 54.76 | 53.98 | 50.99 | 0.05 | 0.02 | 51.07 | | | |
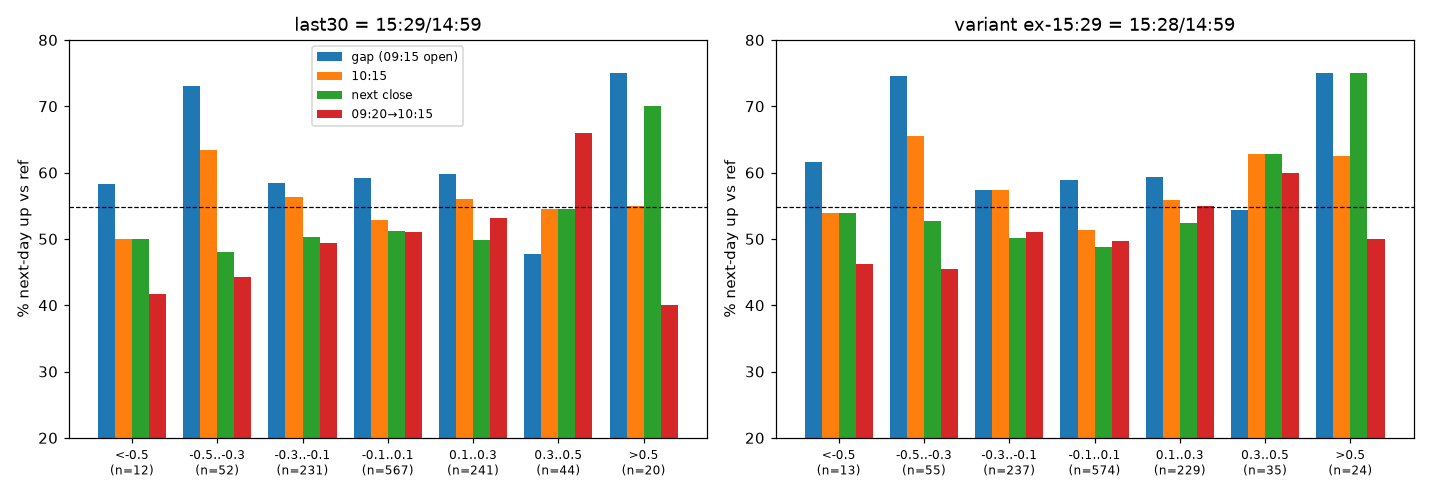
Variant excluding the 15:29 closing-print bar (close 15:28 / 14:59)
| last30 bucket % | n | gap up % | gap same-dir % | gap med % | 09:30 up % | 09:45 up % | 10:15 up % | 11:15 up % | close up % | 10:15 med % | close med % | 09:20→10:15 up % | p gap (binom) | p 10:15 | p 09:20→10:15 |
|---|
| <-0.5 | 13 | 61.54 | 38.46 | 0.19 | 53.85 | 53.85 | 53.85 | 46.15 | 53.85 | 0.04 | 0.18 | 46.15 | 1.00 | 1.00 | 0.79 |
| -0.5..-0.3 | 55 | 74.55 | 25.45 | 0.21 | 72.73 | 69.09 | 65.45 | 65.45 | 52.73 | 0.24 | 0.10 | 45.45 | 0.03 | 0.14 | 0.42 |
| -0.3..-0.1 | 237 | 57.38 | 42.62 | 0.07 | 53.59 | 53.59 | 57.38 | 54.01 | 50.21 | 0.06 | 0.04 | 51.05 | 0.51 | 0.43 | 1.00 |
| -0.1..0.1 | 574 | 58.89 | 52.96 | 0.09 | 55.05 | 52.79 | 51.39 | 52.26 | 48.78 | 0.02 | -0.02 | 49.65 | 0.73 | 0.11 | 0.50 |
| 0.1..0.3 | 229 | 59.39 | 59.39 | 0.11 | 53.28 | 57.64 | 55.90 | 54.59 | 52.40 | 0.06 | 0.04 | 55.02 | 0.95 | 0.74 | 0.23 |
| 0.3..0.5 | 35 | 54.29 | 54.29 | 0.03 | 60.00 | 60.00 | 62.86 | 54.29 | 62.86 | 0.09 | 0.21 | 60.00 | 0.61 | 0.40 | 0.31 |
| >0.5 | 24 | 75.00 | 75.00 | 0.16 | 70.83 | 75.00 | 62.50 | 66.67 | 75.00 | 0.21 | 0.21 | 50.00 | 0.15 | 0.54 | 1.00 |
| ALL (base rate) | 1167 | 59.64 | | 0.09 | 55.70 | 55.36 | 54.76 | 53.98 | 50.99 | 0.05 | 0.02 | 51.07 | | | |
15:29 bar effect by year
| year | n | abs_jump1529_med_pct | abs_jump1529_p90_pct | bucket_changed_pct | corr_l30_l30x |
|---|
| 2022 | 246 | 0.02 | 0.06 | 11.38 | 0.99 |
| 2023 | 245 | 0.01 | 0.04 | 9.39 | 0.99 |
| 2024 | 239 | 0.02 | 0.04 | 8.79 | 0.98 |
| 2025 | 243 | 0.02 | 0.04 | 10.29 | 0.98 |
| 2026 | 194 | 0.02 | 0.09 | 15.46 | 0.92 |
Deciles of last30
| bucket | n | last30_med% | n_gap_%up | n_gap_med% | n_0945_%up | n_1015_%up | n_close_%up | n_from0920_1015_%up | n_gap_p_binom | n_1015_p_binom |
|---|
| D1 | 117 | -0.32 | 65.81 | 0.18 | 64.10 | 63.25 | 55.56 | 47.86 | 0.19 | 0.08 |
| D2 | 117 | -0.17 | 59.83 | 0.09 | 52.99 | 58.97 | 47.01 | 47.01 | 1.00 | 0.40 |
| D3 | 116 | -0.10 | 58.62 | 0.08 | 55.17 | 53.45 | 51.72 | 50.86 | 0.85 | 0.78 |
| D4 | 117 | -0.05 | 55.56 | 0.06 | 54.70 | 53.85 | 47.86 | 49.57 | 0.40 | 0.85 |
| D5 | 117 | -0.01 | 56.41 | 0.08 | 52.14 | 51.28 | 50.43 | 52.14 | 0.51 | 0.46 |
| D6 | 116 | 0.03 | 60.34 | 0.09 | 50.00 | 50.86 | 50.00 | 50.00 | 0.92 | 0.40 |
| D7 | 117 | 0.06 | 58.12 | 0.08 | 52.14 | 47.01 | 49.57 | 52.99 | 0.78 | 0.10 |
| D8 | 116 | 0.11 | 64.66 | 0.15 | 56.03 | 55.17 | 50.86 | 47.41 | 0.30 | 1.00 |
| D9 | 117 | 0.17 | 59.83 | 0.12 | 58.12 | 57.26 | 54.70 | 54.70 | 1.00 | 0.64 |
| D10 | 117 | 0.31 | 57.26 | 0.05 | 58.12 | 56.41 | 52.14 | 58.12 | 0.64 | 0.78 |
Correlation and permutation tests (2,000 shuffles)
| h | spearman | p_perm | spearman_ex1529 |
|---|
| next gap | -0.01 | 0.72 | 0.01 |
| next 0930 | -0.04 | 0.19 | -0.02 |
| next 0945 | -0.03 | 0.23 | -0.02 |
| next 1015 | -0.03 | 0.37 | -0.01 |
| next 1115 | -0.01 | 0.63 | 0.00 |
| next close | 0.02 | 0.47 | 0.03 |
| 09:20→0945 | 0.04 | 0.22 | 0.03 |
| 09:20→1015 | 0.06 | 0.03 | 0.05 |
| 09:20→1115 | 0.05 | 0.11 | 0.04 |
| 09:20→close | 0.08 | 0.00 | 0.07 |
Regression: next move ~ last30 + day trend to 14:59
| h | b_last30 | t_last30 | b_pretrend | t_pretrend |
|---|
| n_gap | -0.03 | -0.41 | 0.05 | 2.61 |
| n_1015 | -0.09 | -0.92 | 0.02 | 0.99 |
| n_close | 0.10 | 0.82 | -0.03 | -1.14 |
Shuffle test per bucket (4,000 random same-size day sets)
| bucket | h | n | %up | base%up | p_shuffle |
|---|
| <-0.5 | n_gap | 12 | 58.33 | 59.64 | 1.00 |
| <-0.5 | n_0945 | 12 | 50.00 | 55.36 | 0.76 |
| <-0.5 | n_1015 | 12 | 50.00 | 54.76 | 0.78 |
| <-0.5 | n_1115 | 12 | 41.67 | 53.98 | 0.54 |
| <-0.5 | n_close | 12 | 50.00 | 50.99 | 1.00 |
| <-0.5 | n_from0920_1015 | 12 | 41.67 | 51.07 | 0.57 |
| -0.5..-0.3 | n_gap | 52 | 73.08 | 59.64 | 0.06 |
| -0.5..-0.3 | n_0945 | 52 | 67.31 | 55.36 | 0.09 |
| -0.5..-0.3 | n_1015 | 52 | 63.46 | 54.76 | 0.21 |
| -0.5..-0.3 | n_1115 | 52 | 61.54 | 53.98 | 0.32 |
| -0.5..-0.3 | n_close | 52 | 48.08 | 50.99 | 0.67 |
| -0.5..-0.3 | n_from0920_1015 | 52 | 44.23 | 51.07 | 0.32 |
| -0.3..-0.1 | n_gap | 231 | 58.44 | 59.64 | 0.70 |
| -0.3..-0.1 | n_0945 | 231 | 53.25 | 55.36 | 0.52 |
| -0.3..-0.1 | n_1015 | 231 | 56.28 | 54.76 | 0.61 |
| -0.3..-0.1 | n_1115 | 231 | 53.68 | 53.98 | 0.94 |
| -0.3..-0.1 | n_close | 231 | 50.22 | 50.99 | 0.83 |
| -0.3..-0.1 | n_from0920_1015 | 231 | 49.35 | 51.07 | 0.61 |
| -0.1..0.1 | n_gap | 567 | 59.26 | 59.64 | 0.80 |
| -0.1..0.1 | n_0945 | 567 | 54.67 | 55.36 | 0.69 |
| -0.1..0.1 | n_1015 | 567 | 52.91 | 54.76 | 0.24 |
| -0.1..0.1 | n_1115 | 567 | 53.79 | 53.98 | 0.91 |
| -0.1..0.1 | n_close | 567 | 51.15 | 50.99 | 0.95 |
| -0.1..0.1 | n_from0920_1015 | 567 | 50.97 | 51.07 | 0.95 |
| 0.1..0.3 | n_gap | 241 | 59.75 | 59.64 | 1.00 |
| 0.1..0.3 | n_0945 | 241 | 55.60 | 55.36 | 0.94 |
| 0.1..0.3 | n_1015 | 241 | 56.02 | 54.76 | 0.66 |
| 0.1..0.3 | n_1115 | 241 | 54.36 | 53.98 | 0.94 |
| 0.1..0.3 | n_close | 241 | 49.79 | 50.99 | 0.73 |
| 0.1..0.3 | n_from0920_1015 | 241 | 53.11 | 51.07 | 0.52 |
| 0.3..0.5 | n_gap | 44 | 47.73 | 59.64 | 0.12 |
| 0.3..0.5 | n_0945 | 44 | 54.55 | 55.36 | 1.00 |
| 0.3..0.5 | n_1015 | 44 | 54.55 | 54.76 | 1.00 |
| 0.3..0.5 | n_1115 | 44 | 47.73 | 53.98 | 0.45 |
| 0.3..0.5 | n_close | 44 | 54.55 | 50.99 | 0.65 |
| 0.3..0.5 | n_from0920_1015 | 44 | 65.91 | 51.07 | 0.05 |
| >0.5 | n_gap | 20 | 75.00 | 59.64 | 0.17 |
| >0.5 | n_0945 | 20 | 70.00 | 55.36 | 0.25 |
| >0.5 | n_1015 | 20 | 55.00 | 54.76 | 1.00 |
| >0.5 | n_1115 | 20 | 60.00 | 53.98 | 0.66 |
| >0.5 | n_close | 20 | 70.00 | 50.99 | 0.11 |
| >0.5 | n_from0920_1015 | 20 | 40.00 | 51.07 | 0.36 |
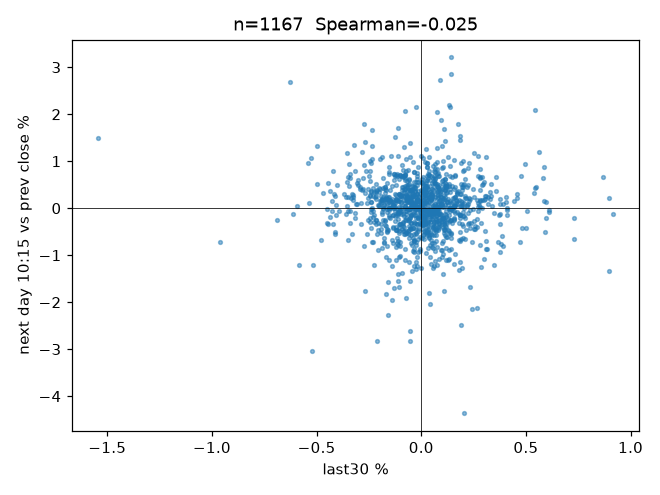
Conditional: day direction and reversal vs continuation
"continuation" = last30 has the same sign as the move from the previous close to 14:59; "reversal into close" = opposite sign.
| last30 | cond | n | n_gap_%up | n_gap_p | n_0945_%up | n_1015_%up | n_1015_p | n_close_%up | n_from0920_1015_%up |
|---|
| big down <-0.3 | down day | 52 | 69.23 | 0.20 | 63.46 | 59.62 | 0.58 | 50.00 | 44.23 |
| big down <-0.3 | up day | 12 | 75.00 | 0.38 | 66.67 | 66.67 | 0.56 | 41.67 | 41.67 |
| mild down | down day | 149 | 54.36 | 0.21 | 48.32 | 51.68 | 0.46 | 47.65 | 49.66 |
| mild down | up day | 82 | 65.85 | 0.26 | 62.20 | 64.63 | 0.08 | 54.88 | 48.78 |
| flat ±0.1 | down day | 253 | 49.80 | 0.00 | 45.85 | 45.06 | 0.00 | 48.62 | 47.43 |
| flat ±0.1 | up day | 314 | 66.88 | 0.01 | 61.78 | 59.24 | 0.11 | 53.18 | 53.82 |
| mild up | down day | 95 | 54.74 | 0.35 | 51.58 | 50.53 | 0.41 | 43.16 | 50.53 |
| mild up | up day | 146 | 63.01 | 0.45 | 58.22 | 59.59 | 0.25 | 54.11 | 54.79 |
| big up >0.3 | down day | 23 | 56.52 | 0.83 | 56.52 | 47.83 | 0.54 | 60.87 | 60.87 |
| big up >0.3 | up day | 41 | 56.10 | 0.64 | 60.98 | 58.54 | 0.64 | 58.54 | 56.10 |
| big down <-0.3 | continuation | 38 | 76.32 | 0.05 | 68.42 | 68.42 | 0.10 | 50.00 | 42.11 |
| big down <-0.3 | reversal into close | 26 | 61.54 | 1.00 | 57.69 | 50.00 | 0.70 | 46.15 | 46.15 |
| mild down | continuation | 118 | 52.54 | 0.13 | 44.92 | 50.00 | 0.31 | 47.46 | 49.15 |
| mild down | reversal into close | 113 | 64.60 | 0.29 | 61.95 | 62.83 | 0.09 | 53.10 | 49.56 |
| flat ±0.1 | continuation | 288 | 60.42 | 0.81 | 55.21 | 55.21 | 0.91 | 51.74 | 53.12 |
| flat ±0.1 | reversal into close | 279 | 58.06 | 0.63 | 54.12 | 50.54 | 0.17 | 50.54 | 48.75 |
| mild up | continuation | 131 | 60.31 | 0.93 | 56.49 | 58.02 | 0.48 | 54.20 | 53.44 |
| mild up | reversal into close | 110 | 59.09 | 0.92 | 54.55 | 53.64 | 0.85 | 44.55 | 52.73 |
| big up >0.3 | continuation | 29 | 58.62 | 1.00 | 68.97 | 65.52 | 0.27 | 51.72 | 58.62 |
| big up >0.3 | reversal into close | 35 | 54.29 | 0.61 | 51.43 | 45.71 | 0.31 | 65.71 | 57.14 |
2. Stability
By year
| year | last30 | n | n_gap_%up | n_gap_med% | n_1015_%up | n_close_%up | n_from0920_1015_%up | spearman_gap | spearman_1015 |
|---|
| 2022 | big down <-0.3 | 29 | 79.31 | 0.36 | 62.07 | 51.72 | 31.03 | | |
| 2022 | big up >0.3 | 21 | 47.62 | -0.01 | 42.86 | 38.10 | 47.62 | | |
| 2023 | big down <-0.3 | 8 | 62.50 | 0.15 | 75.00 | 37.50 | 75.00 | | |
| 2023 | big up >0.3 | 14 | 64.29 | 0.11 | 64.29 | 85.71 | 85.71 | | |
| 2024 | big down <-0.3 | 6 | 66.67 | 0.07 | 50.00 | 50.00 | 33.33 | | |
| 2024 | big up >0.3 | 12 | 66.67 | 0.05 | 66.67 | 75.00 | 75.00 | | |
| 2025 | big down <-0.3 | 7 | 57.14 | 0.21 | 57.14 | 28.57 | 71.43 | | |
| 2025 | big up >0.3 | 7 | 42.86 | -0.01 | 57.14 | 57.14 | 28.57 | | |
| 2026 | big down <-0.3 | 14 | 64.29 | 0.19 | 57.14 | 57.14 | 42.86 | | |
| 2026 | big up >0.3 | 10 | 60.00 | 0.05 | 50.00 | 50.00 | 40.00 | | |
| 2022 | ALL (base) | 246 | 59.76 | 0.12 | 52.44 | 48.37 | 50.41 | 0.02 | 0.06 |
| 2023 | ALL (base) | 245 | 67.76 | 0.13 | 61.22 | 55.92 | 53.47 | -0.03 | 0.00 |
| 2024 | ALL (base) | 239 | 62.34 | 0.12 | 54.81 | 54.81 | 51.88 | -0.02 | -0.04 |
| 2025 | ALL (base) | 243 | 57.20 | 0.05 | 53.91 | 48.97 | 50.62 | -0.07 | -0.09 |
| 2026 | ALL (base) | 194 | 48.97 | -0.01 | 50.52 | 45.88 | 48.45 | -0.08 | -0.12 |
Train 2022–2023 vs test 2024–2026
| split | last30 | n | n_gap_%up | n_gap_base | n_gap_p | n_1015_%up | n_1015_base | n_1015_p | n_from0920_1015_%up | n_from0920_1015_base | n_from0920_1015_p |
|---|
| train 2022-2023 | big down <-0.3 | 37 | 75.68 | 63.75 | 0.17 | 64.86 | 56.82 | 0.41 | 40.54 | 51.93 | 0.19 |
| train 2022-2023 | mild down | 98 | 59.18 | 63.75 | 0.35 | 55.10 | 56.82 | 0.76 | 50.00 | 51.93 | 0.76 |
| train 2022-2023 | flat ±0.1 | 206 | 63.59 | 63.75 | 1.00 | 52.91 | 56.82 | 0.26 | 50.00 | 51.93 | 0.58 |
| train 2022-2023 | mild up | 115 | 66.96 | 63.75 | 0.50 | 64.35 | 56.82 | 0.11 | 57.39 | 51.93 | 0.26 |
| train 2022-2023 | big up >0.3 | 35 | 54.29 | 63.75 | 0.29 | 51.43 | 56.82 | 0.61 | 62.86 | 51.93 | 0.24 |
| train 2022-2023 | ALL | 491 | 63.75 | 63.75 | 1.00 | 56.82 | 56.82 | 1.00 | 51.93 | 51.93 | 1.00 |
| test 2024-2026 | big down <-0.3 | 27 | 62.96 | 56.66 | 0.56 | 55.56 | 53.25 | 0.85 | 48.15 | 50.44 | 0.85 |
| test 2024-2026 | mild down | 133 | 57.89 | 56.66 | 0.79 | 57.14 | 53.25 | 0.39 | 48.87 | 50.44 | 0.73 |
| test 2024-2026 | flat ±0.1 | 361 | 56.79 | 56.66 | 1.00 | 52.91 | 53.25 | 0.92 | 51.52 | 50.44 | 0.71 |
| test 2024-2026 | mild up | 126 | 53.17 | 56.66 | 0.47 | 48.41 | 53.25 | 0.29 | 49.21 | 50.44 | 0.79 |
| test 2024-2026 | big up >0.3 | 29 | 58.62 | 56.66 | 0.85 | 58.62 | 53.25 | 0.58 | 51.72 | 50.44 | 1.00 |
| test 2024-2026 | ALL | 676 | 56.66 | 56.66 | 1.00 | 53.25 | 53.25 | 1.00 | 50.44 | 50.44 | 1.00 |
3. Option-buyer P&L (after costs)
Next day: buy the ATM (nearest 50) strike of the nearest weekly expiry (expiry day included; a variant skipping 0-DTE is in the CSV) at the 09:20 (or 09:16) 1-min close + 3 pts. Exit at the 09:45, 10:15 or 11:15 close − 3 pts, or at a 20-pt premium stop (fill − 20, or the bar open if it gaps through) − 3 pts. Costs: ₹40 brokerage per round trip, STT 0.1% on the sell leg (0.0625% before Oct 2024), exchange fees 0.035%, SEBI fee, stamp duty 0.003%, 18% GST, converted to points per unit using the lot size of the period (25/75/65). Points are per unit (× lot size for ₹). "pctile_vs_random" = where the rule's total ranks among 2,000 random sets of the same number of trades drawn from every-day entries.
Headline: X = 0.3%, entry 09:20, nearest expiry
| mode | exit | sl | trades | win_pct | avg_pts | gross_avg (before 6 pt slip + costs) | total_pts | max_dd_pts | random_mean_total | pctile_vs_random | n_2024 | tot_2024 | n_2025 | tot_2025 | n_2026 | tot_2026 |
|---|
| momentum | 09:45 | none | 42 | 33.33 | -12.42 | -5.37 | -521.56 | 562.38 | -316.32 | 12.60 | 5.00 | -24.94 | 14.00 | -255.62 | 23.00 | -241.00 |
| momentum | 09:45 | 20.00 | 42 | 26.19 | -10.99 | -3.94 | -461.79 | 497.48 | -336.51 | 19.20 | 5.00 | -82.31 | 14.00 | -146.22 | 23.00 | -233.26 |
| momentum | 10:15 | none | 42 | 28.57 | -17.69 | -10.64 | -742.79 | 810.86 | -360.68 | 4.90 | 5.00 | -26.44 | 14.00 | -458.33 | 23.00 | -258.02 |
| momentum | 10:15 | 20.00 | 42 | 19.05 | -12.69 | -5.64 | -533.18 | 550.24 | -363.91 | 18.15 | 5.00 | -79.21 | 14.00 | -251.67 | 23.00 | -202.30 |
| momentum | 11:15 | none | 42 | 30.95 | -11.42 | -4.37 | -479.74 | 514.79 | -394.75 | 38.95 | 5.00 | -88.02 | 14.00 | -113.17 | 23.00 | -278.54 |
| momentum | 11:15 | 20.00 | 42 | 11.90 | -16.42 | -9.37 | -689.57 | 715.77 | -418.96 | 7.80 | 5.00 | -100.54 | 14.00 | -277.63 | 23.00 | -311.40 |
| fade | 09:45 | none | 42 | 30.95 | -6.02 | 1.02 | -252.91 | 252.91 | -320.99 | 65.95 | 5.00 | -129.62 | 14.00 | 13.42 | 23.00 | -136.71 |
| fade | 09:45 | 20.00 | 42 | 23.81 | -8.20 | -1.16 | -344.48 | 344.48 | -335.32 | 51.05 | 5.00 | -95.01 | 14.00 | -36.71 | 23.00 | -212.76 |
| fade | 10:15 | none | 42 | 45.24 | -1.08 | 5.97 | -45.50 | 223.03 | -365.76 | 91.40 | 5.00 | -172.56 | 14.00 | 272.05 | 23.00 | -144.99 |
| fade | 10:15 | 20.00 | 42 | 30.95 | -3.17 | 3.88 | -133.18 | 177.05 | -355.77 | 88.15 | 5.00 | -116.59 | 14.00 | 109.73 | 23.00 | -126.32 |
| fade | 11:15 | none | 42 | 33.33 | -13.12 | -6.08 | -550.84 | 550.84 | -389.69 | 29.40 | 5.00 | -202.42 | 14.00 | -184.56 | 23.00 | -163.87 |
| fade | 11:15 | 20.00 | 42 | 19.05 | -11.17 | -4.13 | -469.00 | 469.00 | -419.68 | 43.35 | 5.00 | -111.10 | 14.00 | -32.52 | 23.00 | -325.39 |
| fade_drop_only(CE) | 09:45 | none | 23 | 30.43 | -8.22 | -1.21 | -188.97 | 213.37 | -198.21 | 54.45 | 2.00 | -88.83 | 7.00 | 47.44 | 14.00 | -147.58 |
| fade_drop_only(CE) | 09:45 | 20.00 | 23 | 17.39 | -12.08 | -5.08 | -277.85 | 301.66 | -202.90 | 25.65 | 2.00 | -48.84 | 7.00 | -5.38 | 14.00 | -223.63 |
| fade_drop_only(CE) | 10:15 | none | 23 | 43.48 | -9.10 | -2.09 | -209.19 | 219.51 | -239.00 | 58.25 | 2.00 | -135.51 | 7.00 | 131.02 | 14.00 | -204.70 |
| fade_drop_only(CE) | 10:15 | 20.00 | 23 | 21.74 | -8.54 | -1.54 | -196.41 | 220.12 | -232.26 | 64.10 | 2.00 | -48.84 | 7.00 | 35.31 | 14.00 | -182.88 |
| fade_drop_only(CE) | 11:15 | none | 23 | 30.43 | -21.65 | -14.67 | -497.99 | 498.99 | -230.85 | 10.30 | 2.00 | -130.17 | 7.00 | -222.74 | 14.00 | -145.09 |
| fade_drop_only(CE) | 11:15 | 20.00 | 23 | 8.70 | -17.87 | -10.88 | -411.01 | 411.01 | -253.28 | 13.50 | 2.00 | -48.84 | 7.00 | -71.94 | 14.00 | -290.23 |
| momo_up_only(CE) | 09:45 | none | 19 | 26.32 | -13.74 | -6.62 | -261.15 | 281.04 | -163.34 | 21.00 | 3.00 | -33.42 | 7.00 | -108.89 | 9.00 | -118.85 |
| momo_up_only(CE) | 09:45 | 20.00 | 19 | 26.32 | -9.96 | -2.82 | -189.20 | 209.09 | -167.70 | 42.85 | 3.00 | -33.42 | 7.00 | -70.24 | 9.00 | -85.54 |
| momo_up_only(CE) | 10:15 | none | 19 | 10.53 | -25.45 | -18.34 | -483.58 | 483.58 | -193.28 | 2.95 | 3.00 | -70.21 | 7.00 | -230.77 | 9.00 | -182.61 |
| momo_up_only(CE) | 10:15 | 20.00 | 19 | 10.53 | -14.02 | -6.89 | -266.29 | 266.29 | -183.08 | 23.90 | 3.00 | -30.32 | 7.00 | -114.78 | 9.00 | -121.19 |
| momo_up_only(CE) | 11:15 | none | 19 | 21.05 | -19.63 | -12.51 | -373.05 | 373.05 | -191.54 | 16.20 | 3.00 | -77.16 | 7.00 | -144.14 | 9.00 | -151.75 |
| momo_up_only(CE) | 11:15 | 20.00 | 19 | 15.79 | -15.84 | -8.72 | -301.00 | 301.00 | -217.05 | 28.15 | 3.00 | -51.64 | 7.00 | -110.54 | 9.00 | -138.82 |
| momo_drop_only(PE) | 09:45 | none | 23 | 39.13 | -11.32 | -4.33 | -260.41 | 342.60 | -154.94 | 21.00 | 2.00 | 8.47 | 7.00 | -146.73 | 14.00 | -122.15 |
| momo_drop_only(PE) | 09:45 | 20.00 | 23 | 26.09 | -11.85 | -4.86 | -272.59 | 307.81 | -165.25 | 15.40 | 2.00 | -48.90 | 7.00 | -75.97 | 14.00 | -147.72 |
| momo_drop_only(PE) | 10:15 | none | 23 | 43.48 | -11.27 | -4.28 | -259.20 | 387.16 | -163.90 | 29.65 | 2.00 | 43.77 | 7.00 | -227.56 | 14.00 | -75.42 |
| momo_drop_only(PE) | 10:15 | 20.00 | 23 | 26.09 | -11.60 | -4.62 | -266.89 | 343.71 | -175.79 | 27.45 | 2.00 | -48.90 | 7.00 | -136.89 | 14.00 | -81.11 |
| momo_drop_only(PE) | 11:15 | none | 23 | 39.13 | -4.64 | 2.36 | -106.69 | 249.90 | -209.97 | 69.20 | 2.00 | -10.86 | 7.00 | 30.97 | 14.00 | -126.79 |
| momo_drop_only(PE) | 11:15 | 20.00 | 23 | 8.70 | -16.89 | -9.91 | -388.57 | 435.86 | -199.78 | 10.95 | 2.00 | -48.90 | 7.00 | -167.09 | 14.00 | -172.58 |
X = 0.5% (today's bucket), entry 09:20, no SL
| mode | exit | trades | win_pct | avg_pts | total_pts | pctile_vs_random |
|---|
| momentum | 09:45 | 10 | 20.00 | -13.85 | -138.46 | 24.60 |
| momentum | 10:15 | 10 | 30.00 | -19.58 | -195.78 | 16.40 |
| momentum | 11:15 | 10 | 30.00 | -14.71 | -147.10 | 36.85 |
| fade | 09:45 | 10 | 20.00 | -12.37 | -123.66 | 30.55 |
| fade | 10:15 | 10 | 30.00 | -10.79 | -107.88 | 43.45 |
| fade | 11:15 | 10 | 20.00 | -22.91 | -229.10 | 18.10 |
| fade_drop_only(CE) | 09:45 | 3 | 0.00 | -28.31 | -84.94 | 10.50 |
| fade_drop_only(CE) | 10:15 | 3 | 0.00 | -56.77 | -170.32 | 0.85 |
| fade_drop_only(CE) | 11:15 | 3 | 0.00 | -60.87 | -182.60 | 1.30 |
| momo_up_only(CE) | 09:45 | 7 | 0.00 | -18.42 | -128.91 | 17.85 |
| momo_up_only(CE) | 10:15 | 7 | 14.29 | -33.47 | -234.31 | 4.00 |
| momo_up_only(CE) | 11:15 | 7 | 14.29 | -23.32 | -163.21 | 22.95 |
| momo_drop_only(PE) | 09:45 | 3 | 66.67 | -3.18 | -9.55 | 61.65 |
| momo_drop_only(PE) | 10:15 | 3 | 66.67 | 12.84 | 38.53 | 82.50 |
| momo_drop_only(PE) | 11:15 | 3 | 66.67 | 5.37 | 16.11 | 72.35 |
Random-day baseline: buy every day at 09:20
| mode | exit | sl | trades | win_pct | avg_pts | total_pts | max_dd_pts |
|---|
| buy CE | 09:45 | none | 507 | 32.54 | -8.64 | -4379.71 | 4379.71 |
| buy PE | 09:45 | none | 504 | 36.51 | -6.68 | -3364.25 | 3473.73 |
| buy CE | 09:45 | 20.00 | 507 | 27.22 | -8.77 | -4445.63 | 4445.63 |
| buy PE | 09:45 | 20.00 | 504 | 30.75 | -7.11 | -3581.94 | 3666.36 |
| buy CE | 10:15 | none | 507 | 32.15 | -10.17 | -5154.07 | 5157.37 |
| buy PE | 10:15 | none | 504 | 34.92 | -6.98 | -3519.88 | 3605.25 |
| buy CE | 10:15 | 20.00 | 507 | 22.09 | -9.80 | -4967.89 | 4967.89 |
| buy PE | 10:15 | 20.00 | 504 | 25.79 | -7.44 | -3750.95 | 3847.66 |
| buy CE | 11:15 | none | 507 | 36.49 | -10.01 | -5075.11 | 5075.11 |
| buy PE | 11:15 | none | 504 | 33.13 | -8.83 | -4449.65 | 4547.38 |
| buy CE | 11:15 | 20.00 | 507 | 18.74 | -11.05 | -5602.26 | 5602.26 |
| buy PE | 11:15 | 20.00 | 504 | 20.44 | -8.86 | -4463.70 | 4487.30 |
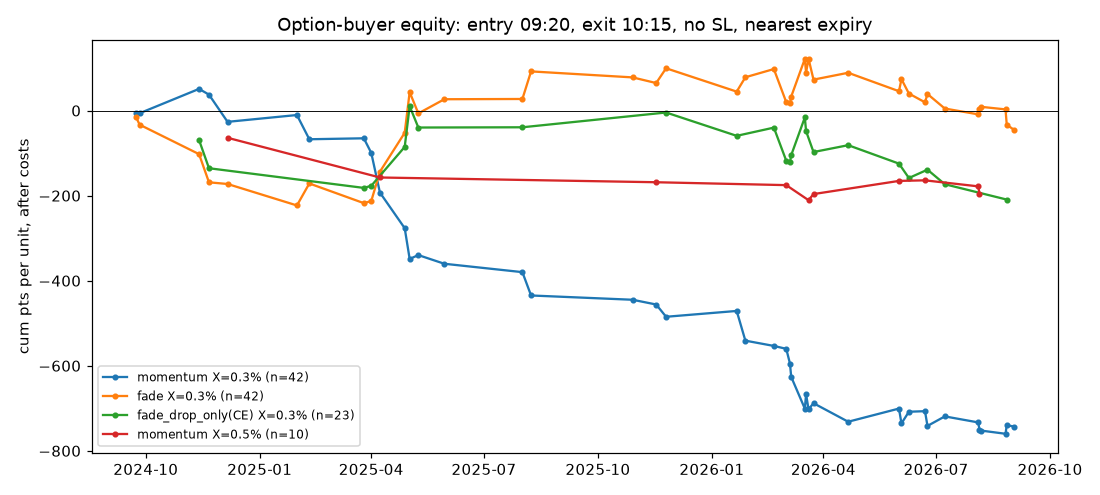
All 960 variants (signal last30 / ex-15:29, X ∈ 0.1/0.2/0.3/0.5%, momentum / fade / drop-only CE / up-only CE / drop-only PE, entry 09:16/09:20, 3 exits, SL on/off, 0-DTE on/off): 12 positive, all with ≤4 trades. Full grid: option_pnl_summary.csv.
Day before expiry (signal day = one trading day before the Nifty weekly expiry)
Expiry calendar: Thursday until Aug 2025 and Tuesday from Sep 2025, with holiday weeks moved to the previous trading day (2022-04-13, 2023-01-25, 2023-03-29, 2023-06-28, 2024-04-10, 2024-08-14, 2025-04-09, 2025-04-30, 2025-10-20, 2026-03-02, 2026-03-30, 2026-04-13, 2026-10-19, 2026-11-23). It matches every option-file expiry from 2024-10-03 to 2026-10-06 exactly (0 mismatches); earlier dates use the rule plus the actual trading days in the spot data. Files: expiry_calendar_2022_2026.csv, pre_expiry_days.csv. Tomorrow, Thu 2026-10-22, is NOT a pre-expiry day: the next expiry is Tue 2026-10-27, so the pre-expiry day is Mon 2026-10-26. The last one was Fri 2026-10-16, before the Dussehra-shifted Mon 2026-10-19 expiry.
Day-before-expiry verdict: FAIL as a rule. It slightly changes the gap pattern but gives no tradeable edge.
- Sample: 250 pre-expiry days vs 917 other days (2022-01 to 2026-10). Pre-expiry days have their own, weaker base: gap up 56.0% vs 60.6% (Fisher p=0.19). At 09:30 they are above the previous close 49.2% vs 57.5% (p=0.022), and the next close is up 45.6% vs 52.5% (p=0.06). Expiry days open slightly softer.
- last30 tends to reverse at the gap on pre-expiry days. After last30 above +0.1%, the gap was up only 48% (n=66) vs 62% on other days. After last30 below −0.1%, the gap was up 70% (n=61) vs 59%. The gap followed last30's direction 39% of the time on pre-expiry days vs 52% on other days (Fisher p=0.016). That is nominal only: about 20 tests were run here, so it fails a multiple-testing correction (Bonferroni would need about 0.0025). The effect is gone by 09:20: from 09:20 to 10:15 the move matched last30's direction 56% vs 52% (p=0.48). The buckets in the table below are small (−0.5..−0.3: n=13, gap up 85%, p=0.049 vs own base; above +0.3: n=10).
- Day-direction carry disappears before expiry. On pre-expiry days, up days gap up 57% vs 55% after down days. On other days it is 67% vs 54% (p=0.003 vs own base). So the one effect that carries on normal days does not hold the day before expiry.
- The option-buyer test of this (overnight hold into expiry day) is on the overnight-carry page. All variants fail.
Bucket table: pre-expiry vs other days
"p_vs_all" = binomial test vs the all-days base; "p_vs_ownbase" = vs the base of that group (pre-expiry days or other days).
| group | bucket | n | n_gap_%up | n_gap_med% | n_gap_p_vs_all | n_gap_p_vs_ownbase | n_0930_%up | n_0945_%up | n_1015_%up | n_1015_p_vs_ownbase | n_close_%up | n_from0920_1015_%up |
|---|
| pre-expiry | <-0.5 | 4 | 25.0 | -1.2 | 0.310 | 0.327 | 25.0 | 25.0 | 50.0 | 1.000 | 50.0 | 25.0 |
| pre-expiry | -0.5..-0.3 | 13 | 84.6 | 0.3 | 0.089 | 0.049 | 92.3 | 84.6 | 84.6 | 0.026 | 53.8 | 46.2 |
| pre-expiry | -0.3..-0.1 | 44 | 70.5 | 0.2 | 0.167 | 0.067 | 47.7 | 54.5 | 59.1 | 0.454 | 45.5 | 45.5 |
| pre-expiry | -0.1..0.1 | 123 | 52.8 | 0.0 | 0.141 | 0.525 | 46.3 | 48.0 | 48.8 | 0.366 | 43.1 | 47.2 |
| pre-expiry | 0.1..0.3 | 56 | 50.0 | -0.0 | 0.173 | 0.420 | 48.2 | 51.8 | 50.0 | 0.689 | 44.6 | 57.1 |
| pre-expiry | 0.3..0.5 | 5 | 40.0 | -0.0 | 0.399 | 0.660 | 60.0 | 80.0 | 80.0 | 0.380 | 80.0 | 60.0 |
| pre-expiry | >0.5 | 5 | 40.0 | -0.3 | 0.399 | 0.660 | 40.0 | 60.0 | 40.0 | 0.670 | 60.0 | 40.0 |
| pre-expiry | ALL | 250 | 56.0 | 0.1 | 0.246 | 1.000 | 49.2 | 52.4 | 53.2 | 1.000 | 45.6 | 48.8 |
| other days | <-0.5 | 8 | 75.0 | 0.3 | 0.487 | 0.493 | 62.5 | 62.5 | 50.0 | 1.000 | 50.0 | 50.0 |
| other days | -0.5..-0.3 | 39 | 69.2 | 0.2 | 0.255 | 0.327 | 64.1 | 61.5 | 56.4 | 1.000 | 46.2 | 43.6 |
| other days | -0.3..-0.1 | 187 | 55.6 | 0.0 | 0.264 | 0.178 | 54.5 | 52.9 | 55.6 | 0.941 | 51.3 | 50.3 |
| other days | -0.1..0.1 | 444 | 61.0 | 0.1 | 0.562 | 0.884 | 59.7 | 56.5 | 54.1 | 0.634 | 53.4 | 52.0 |
| other days | 0.1..0.3 | 185 | 62.7 | 0.1 | 0.411 | 0.599 | 54.1 | 56.8 | 57.8 | 0.506 | 51.4 | 51.9 |
| other days | 0.3..0.5 | 39 | 48.7 | -0.0 | 0.192 | 0.141 | 48.7 | 51.3 | 51.3 | 0.633 | 51.3 | 66.7 |
| other days | >0.5 | 15 | 86.7 | 0.2 | 0.036 | 0.060 | 73.3 | 73.3 | 60.0 | 0.799 | 73.3 | 40.0 |
| other days | ALL | 917 | 60.6 | 0.1 | 0.545 | 1.000 | 57.5 | 56.2 | 55.2 | 1.000 | 52.5 | 51.7 |
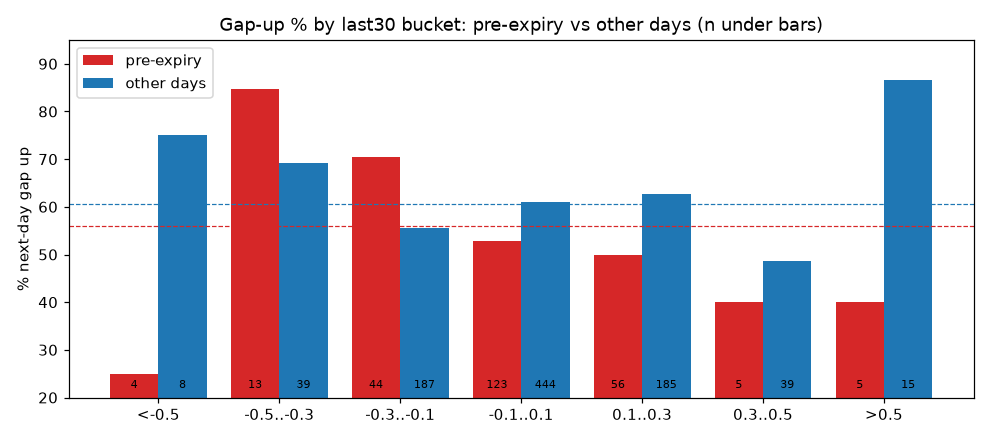
Does the last30 effect differ? (Fisher exact and chi-square)
| test | bucket | h | n_pre | %up_pre | n_other | %up_other | p |
|---|
| Fisher: %up pre vs other, same bucket | last30 up >0.1 | n_gap | 66.0 | 48.5 | 239.0 | 61.9 | 0.066 |
| Fisher: %up pre vs other, same bucket | last30 up >0.1 | n_1015 | 66.0 | 51.5 | 239.0 | 56.9 | 0.485 |
| Fisher: %up pre vs other, same bucket | last30 up >0.1 | n_from0920_1015 | 66.0 | 56.1 | 239.0 | 53.6 | 0.781 |
| Fisher: %up pre vs other, same bucket | last30 down <-0.1 | n_gap | 61.0 | 70.5 | 234.0 | 58.5 | 0.105 |
| Fisher: %up pre vs other, same bucket | last30 down <-0.1 | n_1015 | 61.0 | 63.9 | 234.0 | 55.6 | 0.249 |
| Fisher: %up pre vs other, same bucket | last30 down <-0.1 | n_from0920_1015 | 61.0 | 44.3 | 234.0 | 49.1 | 0.566 |
| Fisher: same-direction rate (effect) pre vs other | last30 up >0.1+last30 down <-0.1 | n_gap | 127.0 | 39.4 | 473.0 | 51.8 | 0.016 |
| Fisher: same-direction rate (effect) pre vs other | last30 up >0.1+last30 down <-0.1 | n_1015 | 127.0 | 44.1 | 473.0 | 50.7 | 0.195 |
| Fisher: same-direction rate (effect) pre vs other | last30 up >0.1+last30 down <-0.1 | n_from0920_1015 | 127.0 | 55.9 | 473.0 | 52.2 | 0.484 |
| Fisher: %up pre vs other, same bucket | last30 > +0.3 | n_gap | 10.0 | 40.0 | 54.0 | 59.3 | 0.312 |
| Fisher: %up pre vs other, same bucket | last30 > +0.3 | n_1015 | 10.0 | 60.0 | 54.0 | 53.7 | 1.000 |
| Fisher: %up pre vs other, same bucket | last30 > +0.3 | n_from0920_1015 | 10.0 | 50.0 | 54.0 | 59.3 | 0.731 |
| Fisher: %up pre vs other, same bucket | last30 < -0.3 | n_gap | 17.0 | 70.6 | 47.0 | 70.2 | 1.000 |
| Fisher: %up pre vs other, same bucket | last30 < -0.3 | n_1015 | 17.0 | 76.5 | 47.0 | 55.3 | 0.155 |
| Fisher: %up pre vs other, same bucket | last30 < -0.3 | n_from0920_1015 | 17.0 | 41.2 | 47.0 | 44.7 | 1.000 |
| Fisher: same-direction rate (effect) pre vs other | last30 > +0.3+last30 < -0.3 | n_gap | 27.0 | 33.3 | 101.0 | 45.5 | 0.282 |
| Fisher: same-direction rate (effect) pre vs other | last30 > +0.3+last30 < -0.3 | n_1015 | 27.0 | 37.0 | 101.0 | 49.5 | 0.283 |
| Fisher: same-direction rate (effect) pre vs other | last30 > +0.3+last30 < -0.3 | n_from0920_1015 | 27.0 | 55.6 | 101.0 | 57.4 | 1.000 |
| chi-square: 7 buckets x up/down, pre-expiry days only | all | n_gap | 250.0 | | | | 0.063 |
| chi-square: 7 buckets x up/down, other days only | all | n_gap | | | 917.0 | | 0.094 |
| chi-square: 7 buckets x up/down, pre-expiry days only | all | n_1015 | 250.0 | | | | 0.187 |
| chi-square: 7 buckets x up/down, other days only | all | n_1015 | | | 917.0 | | 0.974 |
Day direction (up/down day) on pre-expiry vs other days
| group | day | n | n_gap_%up | n_gap_p_vs_ownbase | n_0945_%up | n_1015_%up | n_close_%up | n_from0920_1015_%up |
|---|
| pre-expiry | down day | 121 | 54.5 | 0.784 | 49.6 | 48.8 | 38.8 | 43.0 |
| pre-expiry | up day | 129 | 57.4 | 0.791 | 55.0 | 57.4 | 51.9 | 54.3 |
| other days | down day | 451 | 53.7 | 0.003 | 49.4 | 49.2 | 50.6 | 50.3 |
| other days | up day | 466 | 67.4 | 0.003 | 62.7 | 60.9 | 54.3 | 53.0 |
Base rates and by year
| h | base_all | base_pre | base_other | p_pre_vs_other |
|---|
| n_gap | 59.6 | 56.0 | 60.6 | 0.191 |
| n_0930 | 55.7 | 49.2 | 57.5 | 0.022 |
| n_0945 | 55.4 | 52.4 | 56.2 | 0.315 |
| n_1015 | 54.8 | 53.2 | 55.2 | 0.616 |
| n_close | 51.0 | 45.6 | 52.5 | 0.063 |
| n_from0920_1015 | 51.1 | 48.8 | 51.7 | 0.433 |
| date | pre | n | gap_up | up1015 | med_gap |
|---|
| 2022 | False | 194 | 60.3 | 51.0 | 0.1 |
| 2022 | True | 52 | 57.7 | 57.7 | 0.3 |
| 2023 | False | 193 | 71.0 | 61.7 | 0.1 |
| 2023 | True | 52 | 55.8 | 59.6 | 0.1 |
| 2024 | False | 187 | 62.6 | 53.5 | 0.1 |
| 2024 | True | 52 | 61.5 | 59.6 | 0.2 |
| 2025 | False | 190 | 56.3 | 56.3 | 0.1 |
| 2025 | True | 53 | 60.4 | 45.3 | 0.1 |
| 2026 | False | 153 | 51.0 | 52.9 | 0.0 |
| 2026 | True | 41 | 41.5 | 41.5 | -0.1 |
Day before expiry + large late move (added 2026-10-21 IST)
Verdict: FAIL. The combination "one trading day before weekly expiry AND a large late-session move" gives no reliable next-morning edge on cleaned data.
- Spot: across 6 fixed definitions × up/down × 3 late-move measures × 7 outcomes, no result survives the Benjamini-Hochberg correction (smallest q = 1.00). The sample is small (max 50 combo days for one definition and direction).
- Options (2024-10..2026-09): no variant reaches 20 trades (max n = 18). 841 of 1728 variants are positive, but only 75 stay positive after removing the single best day. That day is mostly 2026-02-02 (pre-expiry Monday, late move +0.53%, next-day gap +4.9%; ATM call +816 pts).
- One thing to watch (not tradable yet): large down late moves before expiry were followed by a gap up more often than not (for example, ≥1.0x the 20-day average: gap down only 29% of 38 days vs 43% base). Large up late moves before expiry carried into a gap up less often than on normal days (top 20%: 43% vs 73%). Both are nominal only: q = 1.0 after correction, and the option fade trades are not robust.
Data: cleaned Upstox historical 1-minute candles (frozen closing window = missing). The last real spot minute on CAS days (since 2026-08-03) is 15:14, and option bars are real until 15:40. Signal day = one trading day before the weekly expiry (calendar as above). 251 pre-expiry days, 2022-01..2026-10-19. Today (2026-10-21) is pending historical data and is not a pre-expiry day anyway; the next pre-expiry day is Mon 2026-10-26.
Late move measures (real bars only): primary m1 = close 15:14 / close 14:44 − 1 (30 real minutes on every day 2022-2026); m2 = 15:14 / 14:59 − 1 (15 minutes); m3 = old 15:29 / 14:59 − 1 (pre-CAS days only). "Large" definitions, fixed in advance: |move| ≥ 0.3%, ≥ 0.5%; |move| in the top 20% / top 10% of the same day-type's own past history (rolling window, past data only: last 52 pre-expiry days, or 250 other days, minimum 20); |move| ≥ 1.0x / 1.5x the trailing 20-day average |move| for the same window. Up and down moves are reported separately. "Same dir %" is the momentum hit rate; the fade hit rate is 100 minus it. Outcomes are measured from the 15:14 real price (the entry reference). The gap versus the official close is also shown, but on pre-CAS days the official close is a 30-minute VWAP, which biases that number. Comparisons: (a) pre-expiry days without a large move (same direction), (b) non-pre-expiry days with a large move (same direction). Binomial p is against the pre-expiry base rate for that direction; Fisher compares the combo with group (b); BH is applied across all tests.
Spot outcomes, primary measure m1 (14:45→15:14)
| definition | side | n | gap same dir % | 09:16 % | 09:30 % | 09:45 % | 10:15 % | expiry close % | gap same dir % (vs official close) | pre base gap % | pre, not large gap % | non-pre, large gap % | median gap (signed, %) | median 10:15 (signed, %) | median expiry range % | range, pre not large % | min p binom | min q BH | min p Fisher vs non-pre large |
|---|
| abs>=0.3 | up | 24 | 50.0 | 45.8 | 54.2 | 50.0 | 58.3 | 58.3 | 54.2 | 57.8 | 53.8 | 71.9 | 0.0 | 0.1 | 1.1 | 0.8 | 0.227 | 1.000 | 0.073 |
| abs>=0.3 | down | 18 | 38.9 | 44.4 | 55.6 | 50.0 | 61.1 | 50.0 | 44.4 | 42.2 | 36.9 | 29.5 | -0.2 | 0.1 | 1.2 | 0.9 | 0.346 | 1.000 | 0.046 |
| abs>=0.5 | up | 2 | 50.0 | 50.0 | 50.0 | 50.0 | 50.0 | 50.0 | 50.0 | 57.8 | 53.1 | 69.2 | 2.1 | 1.1 | 2.0 | 0.8 | 1.000 | 1.000 | 0.476 |
| abs>=0.5 | down | 3 | 66.7 | 33.3 | 33.3 | 33.3 | 66.7 | 66.7 | 66.7 | 42.2 | 36.4 | 22.2 | 0.0 | 0.0 | 1.0 | 0.9 | 0.577 | 1.000 | 0.184 |
| top20% own-type rolling | up | 23 | 43.5 | 43.5 | 43.5 | 47.8 | 56.5 | 52.2 | 47.8 | 58.0 | 54.1 | 73.2 | -0.1 | 0.1 | 1.0 | 0.8 | 0.204 | 1.000 | 0.010 |
| top20% own-type rolling | down | 18 | 33.3 | 44.4 | 50.0 | 50.0 | 61.1 | 50.0 | 38.9 | 42.0 | 35.9 | 41.7 | -0.2 | 0.1 | 0.9 | 0.9 | 0.249 | 1.000 | 0.197 |
| top10% own-type rolling | up | 12 | 50.0 | 50.0 | 41.7 | 58.3 | 66.7 | 66.7 | 58.3 | 58.0 | 52.3 | 67.9 | -0.0 | 0.1 | 1.0 | 0.8 | 0.248 | 1.000 | 0.311 |
| top10% own-type rolling | down | 12 | 41.7 | 50.0 | 50.0 | 50.0 | 58.3 | 50.0 | 50.0 | 42.0 | 34.7 | 35.7 | -0.1 | 0.1 | 1.0 | 0.9 | 0.566 | 1.000 | 0.057 |
| >=1.0x 20d avg | up | 50 | 54.0 | 48.0 | 42.0 | 52.0 | 54.0 | 48.0 | 60.0 | 57.3 | 50.0 | 68.1 | 0.1 | 0.1 | 0.9 | 0.8 | 0.322 | 1.000 | 0.075 |
| >=1.0x 20d avg | down | 38 | 28.9 | 34.2 | 39.5 | 31.6 | 39.5 | 50.0 | 31.6 | 42.7 | 40.5 | 43.2 | -0.2 | -0.2 | 1.0 | 0.9 | 0.036 | 1.000 | 0.140 |
| >=1.5x 20d avg | up | 30 | 56.7 | 50.0 | 50.0 | 56.7 | 63.3 | 60.0 | 63.3 | 57.3 | 50.0 | 70.6 | 0.1 | 0.2 | 1.0 | 0.8 | 0.102 | 1.000 | 0.185 |
| >=1.5x 20d avg | down | 22 | 27.3 | 36.4 | 50.0 | 40.9 | 50.0 | 54.5 | 31.8 | 42.7 | 38.9 | 42.1 | -0.2 | 0.0 | 1.0 | 0.9 | 0.196 | 1.000 | 0.233 |
Alternate measures (compact)
m2 (15:00→15:14):
| definition | side | n | gap same dir % | 10:15 % | expiry close % | pre base gap % | non-pre, large gap % | min p binom | min q BH |
|---|
| abs>=0.3 | up | 11 | 36.4 | 54.5 | 63.6 | 57.8 | 62.5 | 0.221 | 1.000 |
| abs>=0.3 | down | 12 | 50.0 | 50.0 | 50.0 | 42.2 | 29.7 | 0.570 | 1.000 |
| abs>=0.5 | up | 1 | 0.0 | 0.0 | 0.0 | 57.8 | 50.0 | 0.422 | 1.000 |
| abs>=0.5 | down | 2 | 100.0 | 100.0 | 100.0 | 42.2 | 33.3 | 0.178 | 1.000 |
| top20% own-type rolling | up | 22 | 45.5 | 54.5 | 50.0 | 58.0 | 64.0 | 0.281 | 1.000 |
| top20% own-type rolling | down | 24 | 37.5 | 45.8 | 41.7 | 42.0 | 41.3 | 0.310 | 1.000 |
| top10% own-type rolling | up | 12 | 41.7 | 58.3 | 66.7 | 58.0 | 65.7 | 0.248 | 1.000 |
| top10% own-type rolling | down | 15 | 40.0 | 60.0 | 53.3 | 42.0 | 31.2 | 0.439 | 1.000 |
| >=1.0x 20d avg | up | 56 | 53.6 | 46.4 | 46.4 | 57.3 | 64.6 | 0.350 | 1.000 |
| >=1.0x 20d avg | down | 46 | 23.9 | 43.5 | 47.8 | 42.7 | 42.8 | 0.007 | 1.000 |
| >=1.5x 20d avg | up | 31 | 58.1 | 51.6 | 45.2 | 57.3 | 63.6 | 0.470 | 1.000 |
| >=1.5x 20d avg | down | 27 | 37.0 | 55.6 | 55.6 | 42.7 | 40.0 | 0.442 | 1.000 |
m3 (old 14:59→15:29, pre-CAS days only):
| definition | side | n | gap same dir % | 10:15 % | expiry close % | pre base gap % | non-pre, large gap % | min p binom | min q BH |
|---|
| abs>=0.3 | up | 9 | 44.4 | 66.7 | 77.8 | 56.9 | 59.2 | 0.096 | 1.000 |
| abs>=0.3 | down | 17 | 29.4 | 23.5 | 47.1 | 43.1 | 29.2 | 0.049 | 1.000 |
| abs>=0.5 | up | 4 | 50.0 | 50.0 | 75.0 | 56.9 | 85.7 | 0.354 | 1.000 |
| abs>=0.5 | down | 4 | 75.0 | 50.0 | 50.0 | 43.1 | 22.2 | 0.317 | 1.000 |
| top20% own-type rolling | up | 21 | 42.9 | 52.4 | 57.1 | 57.1 | 56.2 | 0.191 | 1.000 |
| top20% own-type rolling | down | 25 | 28.0 | 36.0 | 48.0 | 42.9 | 34.1 | 0.109 | 1.000 |
| top10% own-type rolling | up | 11 | 36.4 | 54.5 | 81.8 | 57.1 | 63.2 | 0.035 | 1.000 |
| top10% own-type rolling | down | 12 | 33.3 | 41.7 | 50.0 | 42.9 | 35.0 | 0.572 | 1.000 |
| >=1.0x 20d avg | up | 42 | 52.4 | 59.5 | 52.4 | 56.8 | 64.7 | 0.280 | 1.000 |
| >=1.0x 20d avg | down | 43 | 25.6 | 32.6 | 53.5 | 43.2 | 38.8 | 0.021 | 1.000 |
| >=1.5x 20d avg | up | 22 | 59.1 | 68.2 | 59.1 | 56.8 | 60.7 | 0.196 | 1.000 |
| >=1.5x 20d avg | down | 27 | 29.6 | 40.7 | 51.9 | 43.2 | 38.9 | 0.124 | 1.000 |
Year by year (m1): combo days and gap same-direction %
| definition | side | gap same % 2022 | gap same % 2023 | gap same % 2024 | gap same % 2025 | gap same % 2026 | n 2022 | n 2023 | n 2024 | n 2025 | n 2026 |
|---|
| >=1.0x 20d avg | down | 27.3 | 25.0 | 42.9 | 22.2 | 28.6 | 11.0 | 4.0 | 7.0 | 9.0 | 7.0 |
| >=1.0x 20d avg | up | 72.7 | 50.0 | 50.0 | 40.0 | 60.0 | 11.0 | 16.0 | 8.0 | 10.0 | 5.0 |
| >=1.5x 20d avg | down | 20.0 | 25.0 | 40.0 | 0.0 | 40.0 | 5.0 | 4.0 | 5.0 | 3.0 | 5.0 |
| >=1.5x 20d avg | up | 75.0 | 45.5 | 25.0 | 60.0 | 100.0 | 8.0 | 11.0 | 4.0 | 5.0 | 2.0 |
| abs>=0.3 | down | 33.3 | 33.3 | 66.7 | 0.0 | 50.0 | 6.0 | 3.0 | 3.0 | 2.0 | 4.0 |
| abs>=0.3 | up | 66.7 | 40.0 | 0.0 | | 50.0 | 9.0 | 10.0 | 1.0 | | 4.0 |
| abs>=0.5 | down | 0.0 | | 100.0 | | | 1.0 | | 2.0 | | |
| abs>=0.5 | up | | 0.0 | | | 100.0 | | 1.0 | | | 1.0 |
| top10% own-type rolling | down | 0.0 | 50.0 | 66.7 | 0.0 | 66.7 | 1.0 | 2.0 | 3.0 | 3.0 | 3.0 |
| top10% own-type rolling | up | 50.0 | 25.0 | 0.0 | 100.0 | 66.7 | 2.0 | 4.0 | 1.0 | 2.0 | 3.0 |
| top20% own-type rolling | down | 0.0 | 33.3 | 40.0 | 20.0 | 50.0 | 1.0 | 3.0 | 5.0 | 5.0 | 4.0 |
| top20% own-type rolling | up | 60.0 | 28.6 | 50.0 | 50.0 | 40.0 | 5.0 | 7.0 | 2.0 | 4.0 | 5.0 |
Option-buyer trades on the combo (m1 signal at 15:14)
Entries: option 15:14 close, 15:15 open, or 15:25 close, all with the 15:14 signal and +3 pts slippage. Instruments: the contract expiring next day, or the following weekly; ATM or 1 ITM (strike from the 15:14 spot). Exits: next day at 09:15 open, 09:16, 09:30, 09:45 or 10:15 close, or hold to 11:00 with a 30% premium stop (expiry-day gamma variant); −3 pts slippage. Costs: brokerage, STT, exchange fee, SEBI fee, stamp duty and GST. Momentum = CE after an up move or PE after a down move; fade = the opposite. Percentile = rank of the total against 2,000 random same-size sets of pre-expiry days (same option and variant). Option data covers 2024-10-01..2026-09-28 (104 pre-expiry days; 2024-08/09 has no next-day-expiry contract in the dataset). Every row below has n < 20.
Totals: 1728 variants (6 definitions × 2 sides × 2 modes × 2 expiries × 2 strikes × 3 entries × 6 exits). 841 positive, 283 beat 95% of random sets, 0 with n ≥ 20, and 75 positive after removing each variant's best day. m2 signal: 1584 variants, 821 positive, 0 with n ≥ 20.
| definition | side | mode | variants | n | positive | positive_ex_best_day | beat95 |
|---|
| >=1.0x 20d avg | down | fade | 72 | 18 | 3 | 0 | 0 |
| >=1.0x 20d avg | down | momentum | 72 | 18 | 22 | 0 | 0 |
| >=1.0x 20d avg | up | fade | 72 | 14 | 45 | 0 | 0 |
| >=1.0x 20d avg | up | momentum | 72 | 14 | 30 | 0 | 1 |
| >=1.5x 20d avg | down | fade | 72 | 11 | 8 | 0 | 0 |
| >=1.5x 20d avg | down | momentum | 72 | 11 | 56 | 2 | 0 |
| >=1.5x 20d avg | up | fade | 72 | 7 | 0 | 0 | 0 |
| >=1.5x 20d avg | up | momentum | 72 | 7 | 72 | 28 | 70 |
| abs>=0.3 | down | fade | 72 | 7 | 1 | 0 | 0 |
| abs>=0.3 | down | momentum | 72 | 7 | 61 | 2 | 0 |
| abs>=0.3 | up | fade | 72 | 4 | 40 | 0 | 0 |
| abs>=0.3 | up | momentum | 72 | 4 | 72 | 0 | 69 |
| abs>=0.5 | down | fade | 72 | 1 | 3 | 0 | 0 |
| abs>=0.5 | down | momentum | 72 | 1 | 62 | 0 | 0 |
| abs>=0.5 | up | fade | 72 | 1 | 0 | 0 | 0 |
| abs>=0.5 | up | momentum | 72 | 1 | 72 | 0 | 72 |
| top10% own-type rolling | down | fade | 72 | 7 | 0 | 0 | 0 |
| top10% own-type rolling | down | momentum | 72 | 7 | 61 | 24 | 0 |
| top10% own-type rolling | up | fade | 72 | 5 | 0 | 0 | 0 |
| top10% own-type rolling | up | momentum | 72 | 5 | 72 | 5 | 71 |
| top20% own-type rolling | down | fade | 72 | 12 | 2 | 0 | 0 |
| top20% own-type rolling | down | momentum | 72 | 12 | 58 | 14 | 0 |
| top20% own-type rolling | up | fade | 72 | 9 | 45 | 0 | 0 |
| top20% own-type rolling | up | momentum | 72 | 9 | 56 | 0 | 0 |
Best variant per definition, side and mode (in-sample best = optimistic)
| definition | side | mode | variant | n | n<20 | win_pct | avg | median | total | maxdd | total_ex_best_day | pctile vs random |
|---|
| >=1.5x 20d avg | up | momentum | CE ITM1 next-day expiry, 15:25c→09:15o | 7 | yes | 42.9 | 132.8 | -2.9 | 929.7 | 74.9 | 37.4 | 99.3 |
| abs>=0.5 | up | momentum | CE ITM1 next-day expiry, 15:15o→09:15o | 1 | yes | 100.0 | 895.5 | 895.5 | 895.5 | 0.0 | 0.0 | 99.2 |
| top10% own-type rolling | up | momentum | CE ITM1 next-day expiry, 15:25c→09:15o | 5 | yes | 60.0 | 178.6 | 0.7 | 892.8 | 108.7 | 0.6 | 99.3 |
| abs>=0.3 | up | momentum | CE ITM1 next-day expiry, 15:25c→09:15o | 4 | yes | 50.0 | 186.5 | 1.4 | 746.0 | 257.8 | -146.2 | 96.8 |
| top20% own-type rolling | up | momentum | CE ITM1 next-day expiry, 15:25c→09:15o | 9 | yes | 33.3 | 71.1 | -21.1 | 639.6 | 257.8 | -252.6 | 93.3 |
| >=1.0x 20d avg | up | momentum | CE ITM1 next-day expiry, 15:25c→09:15o | 14 | yes | 35.7 | 38.8 | -12.1 | 542.8 | 257.8 | -349.5 | 91.8 |
| top10% own-type rolling | down | momentum | PE ITM1 next-day expiry, 15:25c→09:16 | 7 | yes | 71.4 | 38.0 | 65.3 | 266.2 | 200.0 | 17.2 | 89.9 |
| abs>=0.3 | down | momentum | PE ITM1 next-day expiry, 15:25c→10:15 | 7 | yes | 57.1 | 35.0 | 88.2 | 244.9 | 197.4 | 11.3 | 83.3 |
| >=1.0x 20d avg | up | fade | PE ITM1 next-day expiry, 15:14c→09:16 | 14 | yes | 50.0 | 17.4 | -2.9 | 244.0 | 330.7 | -90.7 | 79.2 |
| top20% own-type rolling | down | momentum | PE ITM1 next-day expiry, 15:25c→10:15 | 12 | yes | 58.3 | 20.0 | 25.1 | 240.4 | 197.4 | 6.8 | 75.3 |
| top20% own-type rolling | up | fade | PE ITM1 next-day expiry, 15:15o→09:30 | 9 | yes | 44.4 | 25.3 | -1.3 | 227.4 | 184.7 | -124.9 | 78.0 |
| >=1.5x 20d avg | down | momentum | PE ITM1 next-day expiry, 15:25c→09:45 | 11 | yes | 45.5 | 15.6 | -16.5 | 171.1 | 188.6 | 19.1 | 69.3 |
| abs>=0.3 | up | fade | PE ITM1 next-day expiry, 15:14c→09:16 | 4 | yes | 50.0 | 40.0 | -8.4 | 160.2 | 291.1 | -174.5 | 85.0 |
| >=1.0x 20d avg | down | momentum | PE ITM1 following weekly, 15:25c→09:30 | 18 | yes | 61.1 | 8.6 | 3.4 | 154.5 | 213.0 | -12.9 | 61.4 |
| abs>=0.5 | down | momentum | PE ITM1 next-day expiry, 15:25c→10:15 | 1 | yes | 100.0 | 101.7 | 101.7 | 101.7 | 0.0 | 0.0 | 89.6 |
| >=1.0x 20d avg | down | fade | CE ITM1 following weekly, 15:14c→09:15o | 18 | yes | 44.4 | 1.5 | -0.4 | 26.2 | 157.2 | -121.7 | 78.1 |
| top20% own-type rolling | down | fade | CE ATM following weekly, 15:14c→09:15o | 12 | yes | 41.7 | 1.7 | -2.5 | 20.8 | 158.2 | -133.8 | 81.8 |
| >=1.5x 20d avg | down | fade | CE ATM next-day expiry, 15:14c→09:15o | 11 | yes | 45.5 | 1.5 | -0.3 | 16.0 | 143.8 | -163.3 | 84.8 |
| abs>=0.5 | down | fade | CE ATM next-day expiry, 15:14c→09:15o | 1 | yes | 100.0 | 4.0 | 4.0 | 4.0 | 0.0 | 0.0 | 79.9 |
| abs>=0.3 | down | fade | CE ATM next-day expiry, 15:14c→09:15o | 7 | yes | 57.1 | 0.1 | 4.0 | 1.0 | 116.2 | -178.3 | 83.5 |
| top10% own-type rolling | down | fade | CE ATM following weekly, 15:25c→09:15o | 7 | yes | 28.6 | -2.4 | -4.2 | -16.9 | 158.2 | -184.9 | 73.0 |
| abs>=0.5 | up | fade | PE ATM next-day expiry, 15:25c→09:16 | 1 | yes | 0.0 | -94.6 | -94.6 | -94.6 | 94.6 | 0.0 | 2.8 |
| top10% own-type rolling | up | fade | PE ATM next-day expiry, 15:14c→09:15o | 5 | yes | 20.0 | -43.9 | -21.9 | -219.7 | 276.4 | -276.4 | 3.9 |
| >=1.5x 20d avg | up | fade | PE ATM next-day expiry, 15:25c→09:30 | 7 | yes | 28.6 | -36.8 | -4.9 | -257.5 | 261.0 | -264.5 | 4.9 |
Reference: ≥1.0x 20-day average, ATM, next-day expiry, 15:15 open entry, every exit
| side | mode | typ | exit | n | win_pct | avg | median | total | maxdd | total_ex_best_day | pctile_vs_random_pre | tot_2026 | tot_2024 | tot_2025 |
|---|
| up | momentum | CE | 09:15o | 14 | 14.3 | 23.9 | -20.6 | 334.6 | 280.5 | -481.0 | 87.9 | 561.6 | | -227.0 |
| up | momentum | CE | 09:16 | 14 | 14.3 | -6.5 | -34.7 | -91.0 | 331.0 | -661.8 | 87.1 | 239.9 | | -330.8 |
| up | momentum | CE | 09:30 | 14 | 7.1 | -13.2 | -49.9 | -184.4 | 440.8 | -781.3 | 84.7 | 256.3 | | -440.8 |
| up | momentum | CE | 09:45 | 14 | 28.6 | -11.7 | -47.9 | -164.0 | 360.5 | -661.2 | 86.8 | 136.7 | | -300.7 |
| up | momentum | CE | 10:15 | 14 | 35.7 | 4.8 | -29.7 | 66.6 | 300.2 | -455.6 | 94.0 | 222.0 | | -155.4 |
| up | momentum | CE | 11:00stop30 | 14 | 7.1 | -5.0 | -31.0 | -69.6 | 345.4 | -674.5 | 86.1 | 259.5 | | -329.1 |
| up | fade | PE | 09:15o | 14 | 50.0 | -3.0 | -6.3 | -42.6 | 299.1 | -189.3 | 68.8 | -36.2 | | -6.5 |
| up | fade | PE | 09:16 | 14 | 50.0 | 13.1 | -6.6 | 182.8 | 303.0 | -127.2 | 78.5 | 149.9 | | 32.9 |
| up | fade | PE | 09:30 | 14 | 42.9 | 10.3 | -9.5 | 143.9 | 255.9 | -182.5 | 69.2 | 70.5 | | 73.4 |
| up | fade | PE | 09:45 | 14 | 50.0 | 9.0 | -7.9 | 126.2 | 249.4 | -162.4 | 73.3 | 73.1 | | 53.2 |
| up | fade | PE | 10:15 | 14 | 21.4 | -14.1 | -44.1 | -197.8 | 473.4 | -473.4 | 29.6 | -45.2 | | -152.7 |
| up | fade | PE | 11:00stop30 | 14 | 14.3 | -20.9 | -30.7 | -292.4 | 472.6 | -472.6 | 13.2 | -118.3 | | -174.1 |
| down | momentum | PE | 09:15o | 18 | 22.2 | -18.8 | -21.7 | -337.9 | 337.9 | -540.2 | 16.0 | -73.1 | -117.2 | -147.6 |
| down | momentum | PE | 09:16 | 18 | 33.3 | -4.5 | -15.3 | -81.6 | 210.8 | -293.0 | 43.5 | -14.2 | -10.3 | -57.1 |
| down | momentum | PE | 09:30 | 18 | 38.9 | -3.0 | -7.3 | -54.8 | 194.5 | -197.1 | 39.4 | -10.2 | -24.4 | -20.2 |
| down | momentum | PE | 09:45 | 18 | 38.9 | -11.8 | -26.7 | -213.0 | 310.7 | -330.4 | 29.0 | -137.1 | 97.7 | -173.6 |
| down | momentum | PE | 10:15 | 18 | 44.4 | -10.7 | -29.0 | -192.6 | 233.8 | -385.1 | 32.2 | -73.4 | 41.2 | -160.4 |
| down | momentum | PE | 11:00stop30 | 18 | 27.8 | -12.2 | -23.6 | -219.7 | 288.2 | -438.9 | 27.6 | 34.7 | -44.5 | -209.8 |
| down | fade | CE | 09:15o | 18 | 33.3 | -9.9 | -2.9 | -177.4 | 334.2 | -356.6 | 68.8 | -0.3 | 44.1 | -221.1 |
| down | fade | CE | 09:16 | 18 | 33.3 | -21.8 | -16.3 | -391.5 | 447.7 | -499.1 | 65.8 | -164.1 | -14.6 | -212.9 |
| down | fade | CE | 09:30 | 18 | 22.2 | -32.6 | -24.5 | -586.6 | 631.4 | -728.5 | 54.4 | -181.1 | -91.8 | -313.7 |
| down | fade | CE | 09:45 | 18 | 22.2 | -36.7 | -29.1 | -660.4 | 660.4 | -693.3 | 39.0 | -194.8 | -173.4 | -292.2 |
| down | fade | CE | 10:15 | 18 | 27.8 | -36.7 | -26.7 | -660.7 | 742.5 | -742.5 | 40.6 | -260.0 | -87.3 | -313.3 |
| down | fade | CE | 11:00stop30 | 18 | 22.2 | -28.8 | -31.8 | -518.2 | 551.2 | -596.0 | 49.5 | -267.6 | -44.8 | -205.8 |
Every combo day 2024-2026 (any definition, m1): 47 days, 33 with option data
"Best trade" is the best of all 72 option variants that day, chosen with hindsight; it is only there to help you eyeball the days. The two reference columns are fixed: the ATM next-day-expiry option bought at the 15:15 open and sold at the 09:15 open.
| date | side | late move 14:45→15:14 % | gap vs 15:14 % | gap vs official close % | 10:15 vs 15:14 % | expiry close vs 15:14 % | expiry range % | momentum ATM next-day 15:15→09:15 pts | fade ATM next-day 15:15→09:15 pts | best trade (hindsight) | best pts | qualifies under |
|---|
| 2024-01-10 | up | 0.2 | 0.4 | 0.3 | 0.3 | 0.2 | 0.6 | | | no option data | | >=1.0x 20d avg |
| 2024-01-24 | up | 0.1 | -0.0 | 0.0 | -0.4 | -0.5 | 1.0 | | | no option data | | >=1.0x 20d avg |
| 2024-01-31 | up | 0.1 | 0.2 | 0.3 | 0.2 | -0.1 | 0.8 | | | no option data | | >=1.0x 20d avg |
| 2024-02-21 | up | 0.3 | -0.1 | 0.1 | -0.8 | 0.6 | 1.7 | | | no option data | | >=1.0x 20d avg; >=1.5x 20d avg |
| 2024-04-30 | down | -0.6 | -0.2 | -0.2 | 0.2 | 0.2 | 0.6 | | | no option data | | >=1.0x 20d avg; >=1.5x 20d avg; abs>=0.3; abs>=0.5; top10% own-type rolling; top20% own-type rolling |
| 2024-06-19 | down | -0.4 | 0.3 | 0.3 | -0.1 | 0.2 | 0.8 | | | no option data | | >=1.0x 20d avg; >=1.5x 20d avg; abs>=0.3; top10% own-type rolling; top20% own-type rolling |
| 2024-08-07 | up | 0.2 | -0.3 | -0.2 | -0.6 | -0.8 | 1.1 | | | no option data | | >=1.0x 20d avg; >=1.5x 20d avg |
| 2024-08-28 | down | -0.2 | -0.1 | -0.1 | 0.2 | 0.4 | 0.8 | | | no option data | | >=1.0x 20d avg |
| 2024-09-04 | up | 0.1 | 0.2 | 0.2 | -0.0 | -0.3 | 0.6 | | | no option data | | >=1.0x 20d avg |
| 2024-09-11 | down | -0.1 | 0.6 | 0.6 | 0.5 | 2.0 | 2.0 | | | no option data | | >=1.0x 20d avg |
| 2024-09-18 | up | 0.2 | 0.4 | 0.4 | 0.5 | 0.1 | 0.9 | | | no option data | | >=1.0x 20d avg; >=1.5x 20d avg; top20% own-type rolling |
| 2024-09-25 | up | 0.3 | -0.0 | 0.0 | 0.2 | 0.8 | 1.0 | | | no option data | | >=1.0x 20d avg; >=1.5x 20d avg; abs>=0.3; top10% own-type rolling; top20% own-type rolling |
| 2024-10-09 | down | -0.3 | 0.4 | 0.3 | 0.6 | 0.1 | 0.6 | -72.3 | 42.8 | CE ITM1 next-day expiry, 15:15o->10:15 | 100.1 | >=1.0x 20d avg; >=1.5x 20d avg; top20% own-type rolling |
| 2024-10-16 | down | -0.2 | 0.2 | 0.2 | -0.5 | -0.9 | 1.2 | -13.6 | -1.4 | PE ITM1 next-day expiry, 15:14c->09:45 | 109.6 | >=1.0x 20d avg; >=1.5x 20d avg; top20% own-type rolling |
| 2024-11-19 | down | -0.9 | -0.0 | -0.1 | -0.8 | -0.6 | 1.0 | -31.3 | 2.6 | PE ITM1 next-day expiry, 15:25c->10:15 | 101.7 | >=1.0x 20d avg; >=1.5x 20d avg; abs>=0.3; abs>=0.5; top10% own-type rolling; top20% own-type rolling |
| 2025-01-01 | down | -0.1 | 0.2 | 0.2 | 0.4 | 1.9 | 2.0 | -18.1 | -28.3 | CE ITM1 next-day expiry, 15:14c->11:00stop30 | 91.1 | >=1.0x 20d avg |
| 2025-01-22 | up | 0.2 | -0.2 | -0.1 | 0.2 | 0.2 | 0.8 | -27.2 | 6.7 | CE ITM1 following weekly, 15:25c->10:15 | 33.7 | >=1.0x 20d avg; >=1.5x 20d avg |
| 2025-02-05 | down | -0.2 | 0.3 | 0.3 | -0.3 | -0.4 | 0.9 | -28.6 | -1.8 | PE ITM1 following weekly, 15:14c->10:15 | 30.8 | >=1.0x 20d avg |
| 2025-02-12 | up | 0.3 | 0.0 | 0.0 | 0.6 | -0.1 | 1.1 | -6.3 | -15.9 | CE ITM1 next-day expiry, 15:14c->10:15 | 88.9 | >=1.0x 20d avg; >=1.5x 20d avg; top10% own-type rolling; top20% own-type rolling |
| 2025-02-19 | up | 0.3 | -0.5 | -0.5 | -0.3 | -0.1 | 0.5 | -49.7 | 23.0 | PE ITM1 next-day expiry, 15:14c->09:15o | 80.1 | >=1.0x 20d avg; top20% own-type rolling |
| 2025-03-12 | up | 0.1 | 0.3 | 0.3 | 0.3 | -0.3 | 0.8 | -7.6 | -16.2 | CE ITM1 next-day expiry, 15:25c->10:15 | 40.2 | >=1.0x 20d avg |
| 2025-03-26 | down | -0.1 | -0.3 | -0.2 | 0.4 | 0.4 | 1.0 | 16.6 | -53.4 | CE ITM1 next-day expiry, 15:25c->10:15 | 62.1 | >=1.0x 20d avg |
| 2025-04-02 | up | 0.1 | -0.8 | -0.8 | -0.3 | -0.4 | 0.7 | -50.0 | 52.8 | PE ITM1 following weekly, 15:14c->09:15o | 120.3 | >=1.0x 20d avg |
| 2025-04-08 | down | -0.2 | -0.3 | -0.3 | -0.7 | -0.6 | 0.5 | 12.7 | -91.8 | PE ITM1 following weekly, 15:25c->09:30 | 101.9 | >=1.0x 20d avg; top20% own-type rolling |
| 2025-04-23 | up | 0.2 | -0.2 | -0.2 | -0.2 | -0.4 | 0.5 | -14.0 | 3.2 | PE ITM1 next-day expiry, 15:15o->09:30 | 20.2 | >=1.0x 20d avg; >=1.5x 20d avg; top20% own-type rolling |
| 2025-05-14 | up | 0.2 | 0.1 | 0.1 | -0.4 | 1.6 | 2.5 | -0.8 | -31.7 | PE ITM1 next-day expiry, 15:25c->09:45 | 109.2 | >=1.0x 20d avg; >=1.5x 20d avg |
| 2025-05-28 | down | -0.1 | 0.3 | 0.3 | 0.2 | 0.3 | 0.9 | -64.1 | -3.9 | CE ITM1 next-day expiry, 15:25c->09:16 | 61.8 | >=1.0x 20d avg |
| 2025-06-18 | up | 0.1 | -0.0 | -0.0 | 0.1 | -0.1 | 0.5 | -29.9 | -32.2 | CE ITM1 next-day expiry, 15:25c->09:15o | 2.4 | >=1.0x 20d avg |
| 2025-07-02 | up | 0.2 | 0.2 | 0.2 | 0.3 | -0.2 | 0.8 | -6.5 | -21.8 | CE ITM1 next-day expiry, 15:25c->10:15 | 41.9 | >=1.0x 20d avg; >=1.5x 20d avg; top10% own-type rolling; top20% own-type rolling |
| 2025-08-26 | down | -0.3 | 0.0 | -0.1 | -0.5 | -0.8 | 0.9 | -1.2 | -11.0 | PE ITM1 next-day expiry, 15:25c->09:30 | 133.0 | >=1.0x 20d avg; >=1.5x 20d avg; abs>=0.3; top10% own-type rolling; top20% own-type rolling |
| 2025-09-08 | down | -0.4 | 0.4 | 0.4 | 0.2 | 0.4 | 0.3 | -21.7 | 10.3 | CE ITM1 next-day expiry, 15:14c->09:30 | 43.9 | >=1.0x 20d avg; >=1.5x 20d avg; abs>=0.3; top10% own-type rolling; top20% own-type rolling |
| 2025-09-29 | down | -0.2 | 0.2 | 0.2 | -0.0 | -0.1 | 0.6 | -19.8 | -13.3 | PE ITM1 next-day expiry, 15:25c->09:45 | 16.8 | >=1.0x 20d avg; top20% own-type rolling |
| 2025-11-24 | down | -0.3 | 0.2 | 0.2 | 0.3 | -0.3 | 0.7 | -23.6 | -27.7 | CE ITM1 next-day expiry, 15:25c->10:15 | 14.2 | >=1.0x 20d avg; >=1.5x 20d avg; top10% own-type rolling; top20% own-type rolling |
| 2025-12-08 | up | 0.2 | -0.4 | -0.4 | -0.7 | -0.5 | 0.8 | -35.0 | 25.7 | PE ITM1 next-day expiry, 15:14c->09:45 | 144.2 | >=1.0x 20d avg |
| 2026-01-23 | down | -0.2 | 0.1 | 0.1 | 0.3 | 0.5 | 1.3 | -24.3 | 2.3 | CE ITM1 following weekly, 15:14c->09:45 | 66.9 | >=1.0x 20d avg |
| 2026-02-02 | up | 0.5 | 4.9 | 4.9 | 2.5 | 2.6 | 2.8 | 815.7 | -109.6 | CE ITM1 next-day expiry, 15:15o->09:15o | 895.5 | >=1.0x 20d avg; >=1.5x 20d avg; abs>=0.3; abs>=0.5; top10% own-type rolling; top20% own-type rolling |
| 2026-02-23 | up | 0.2 | -0.3 | -0.3 | -0.9 | -1.1 | 1.2 | -55.9 | 10.2 | PE ITM1 next-day expiry, 15:14c->11:00stop30 | 155.8 | top20% own-type rolling |
| 2026-02-27 | down | -0.5 | -2.0 | -2.1 | -1.1 | -1.2 | 1.5 | 202.3 | -115.3 | PE ITM1 next-day expiry, 15:25c->11:00stop30 | 260.7 | >=1.0x 20d avg; >=1.5x 20d avg; abs>=0.3; top10% own-type rolling; top20% own-type rolling |
| 2026-03-09 | up | 0.4 | 1.0 | 1.1 | 0.6 | 0.9 | 0.9 | 26.4 | -129.4 | CE ITM1 next-day expiry, 15:25c->09:15o | 111.6 | >=1.0x 20d avg; >=1.5x 20d avg; abs>=0.3; top10% own-type rolling; top20% own-type rolling |
| 2026-03-23 | down | -0.4 | 1.6 | 1.6 | 0.9 | 1.8 | 1.9 | -181.2 | 179.2 | CE ATM next-day expiry, 15:25c->09:15o | 192.4 | >=1.0x 20d avg; >=1.5x 20d avg; abs>=0.3; top10% own-type rolling; top20% own-type rolling |
| 2026-04-06 | up | 0.3 | -0.7 | -0.6 | -0.3 | 0.6 | 1.9 | -146.3 | 56.1 | PE ITM1 next-day expiry, 15:14c->09:16 | 116.6 | >=1.0x 20d avg; abs>=0.3; top10% own-type rolling; top20% own-type rolling |
| 2026-04-10 | up | 0.3 | -1.9 | -1.9 | -1.7 | -0.9 | 1.5 | -134.2 | 146.7 | PE ITM1 next-day expiry, 15:15o->09:30 | 352.2 | >=1.0x 20d avg; abs>=0.3; top20% own-type rolling |
| 2026-05-11 | down | -0.5 | -0.3 | -0.4 | -0.7 | -1.8 | 1.7 | 4.6 | -72.5 | PE ITM1 next-day expiry, 15:25c->11:00stop30 | 136.2 | >=1.0x 20d avg; >=1.5x 20d avg; abs>=0.3; top10% own-type rolling; top20% own-type rolling |
| 2026-06-15 | down | -0.3 | 0.3 | 0.3 | 0.3 | 0.6 | 0.5 | -52.8 | 6.4 | CE ITM1 next-day expiry, 15:14c->11:00stop30 | 35.9 | >=1.0x 20d avg; >=1.5x 20d avg; abs>=0.3; top20% own-type rolling |
| 2026-09-21 | down | -0.1 | 0.1 | 0.2 | 0.1 | -0.4 | 0.9 | -21.7 | -0.4 | PE ITM1 following weekly, 15:25c->11:00stop30 | 16.9 | >=1.0x 20d avg; >=1.5x 20d avg |
| 2026-10-05 | down | -0.1 | 0.3 | 0.2 | 0.5 | 1.1 | 0.8 | | | no option data | | >=1.0x 20d avg |
| 2026-10-16 | up | 0.1 | 0.1 | 0.0 | -0.2 | -1.0 | 1.4 | | | no option data | | >=1.0x 20d avg |
Files: combo_spot.csv, combo_spot_by_year.csv, combo_options_summary.csv, combo_day_list_2024_2026.csv. Scripts: /workspace/research/pre-expiry/combo/ (extract.py, spot.py, opt.py, post.py, section.py).
Method notes and exclusions
- Sessions: only bars from 09:15 to 15:29 are used. Excluded: weekend/special sessions (2024-01-20, 2024-03-02, 2024-05-18, 2025-02-01 budget Saturday, 2026-02-01 Sunday budget), the 2025-10-21 muhurat partial, any day missing a 14:59–15:29 bar, and day pairs with a special session between them. NSE holidays have no bars. Upstox data for 2022-10-24 and 2024-11-01 muhurat sessions falls outside 09:15–15:29 or is absent, so they are excluded too.
- The "previous close" reference is the 15:29 1-min close. It differs from NSE's official close by a median 0.03–0.06%, and this does not change any conclusion.
- Longer history: searched /workspace (all timeframes start 2022-01-03), S3 analyticsdata123 (timeframes/1m,5m,15m,1h all start 2022-01-03; 1d from 2024; an NSE daily index file from 2012 has no intraday bars), and the Upstox v2/v3 historical API (0 candles before 2022). There is no free pre-2022 intraday source.
- Options: 1-min data covers expiries 2024-10-03 → 2026-09-29, so trades run 2024-08-23 → 2026-09-29. October 2026 signal days have no option data yet.
Files
results/: buckets_last30.csv, buckets_last30x.csv, deciles_*.csv, base_rates.csv, conditional.csv, by_year.csv, train_test.csv, shuffle_tests.csv, correlations.csv, regression.csv, jump1529_by_year.csv, option_pnl_summary.csv, option_trades_0920_X0.3_0.5.csv, daily_features.csv