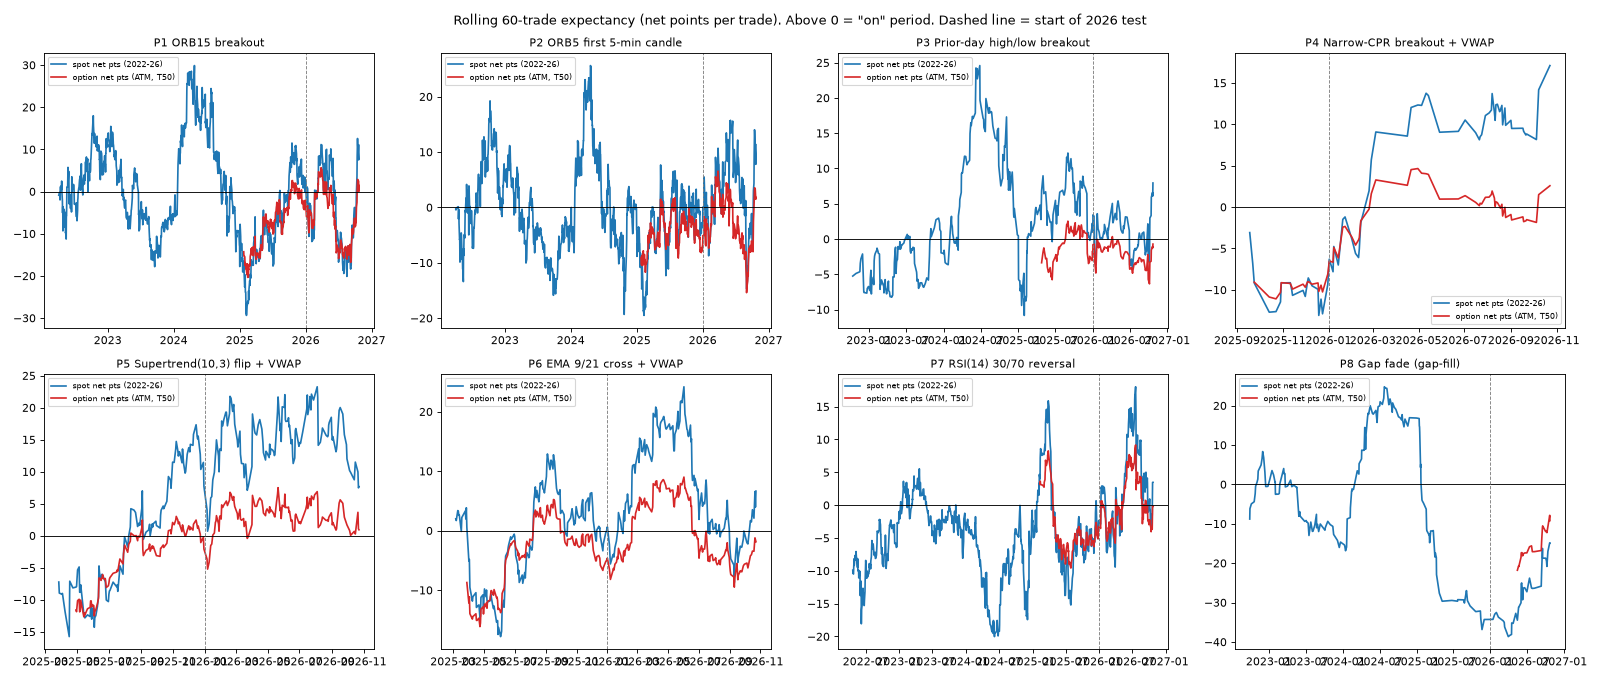
Built 2026-10-27 20:34 IST. Research only, not advice. Read-only data, no orders. Option buyer only (long = buy ATM CE, short = buy ATM PE, nearest weekly with DTE≥1). REAL costs ≈2 pts per round trip. Everything below was pre-declared in PREREG.md (19:20 IST, before any 2026 number). Regime addendum after Satya's 19:17 IST question: “could it be each strategy works for certain periods”.
Summary table · Works in which regime? · By period · Rules · Method and limits · Combinations · Premium support · Trader discretion · YouTube live calls · Expiry cheap counter-trend · Why 20? · 20 without time value
| Strategy | Train Oct-24–Dec-25 n / net pts per trade | Test 2026 n / net pts | 2026 win% | 2026 ₹ total (1 lot) | Pctile vs random entries | p (2026) | BH q (8) | Spot net pts per trade 2022 / 23 / 24 / 25 / 26 | Positive quarters spot · options | Works in which regime? |
|---|---|---|---|---|---|---|---|---|---|---|
| P1 ORB15 breakout | 277 / -8.2 | 181 / -3.2 | 33% | -37,935 | 54 | 0.77 | 0.77 | +3.6 / -6.5 / +7.0 / -5.0 / +1.0 | 10/20 · 2/9 | No stable regime. No filter qualified on the 2024–25 options train. On spot, the walk-forward picked a different label each year (expiry → prior-day range), and the OOS edge was not significant. |
| P2 ORB5 first 5-min candle | 281 / -4.8 | 189 / -0.0 | 34% | -508 | 69 | 0.50 | 0.67 | +2.5 / -5.4 / +1.7 / -1.9 / +7.0 | 8/20 · 2/9 | Lead: after an NR7 day. Chosen on train (+2.1, n=42). 2026: +28.3 pts (n=29, p=0.025, beats 99% of random subsets), but BH q=0.35. Not proven. On spot, the walk-forward kept picking expiry days, which flipped sign year to year. |
| P3 Prior-day high/low breakout | 128 / -2.9 | 74 / +0.9 | 38% | 4,293 | 69 | 0.42 | 0.67 | -6.8 / -0.1 / +8.2 / +3.2 / +7.9 | 11/20 · 3/9 | Lead: after an NR7 day (2026 +23.0, n=15, p=0.10, q=0.39). On spot, the filter flipped between FII-long and prior-day-range labels. Not proven. |
| P4 Narrow-CPR breakout + VWAP | 77 / -10.1 | 51 / +4.8 | 39% | 15,849 | 89 | 0.24 | 0.67 | – / – / +34.1 / -11.1 / +22.1 | 4/9 · 2/9 | Lead: NR7 / compressed prior day (options 2026 +23.7, n=18; spot 2026 +33, n=28, p=0.009, q=0.30). Only one OOS year exists (no VWAP data before Oct-2024). Not proven. |
| P5 Supertrend(10,3) flip + VWAP | 165 / -5.6 | 128 / +4.4 | 44% | 36,828 | 92 | 0.17 | 0.67 | – / – / -4.0 / -0.2 / +16.9 | 7/10 · 4/9 | Mid efficiency-ratio days (0.2–0.4) chosen on train. 2026 +11.9 (n=33, p=0.13). Not proven. The meta-switch hurt. |
| P6 EMA 9/21 cross + VWAP | 202 / -4.4 | 152 / +0.8 | 38% | 8,346 | 75 | 0.42 | 0.67 | – / – / +21.4 / -1.6 / +9.0 | 8/10 · 4/9 | No. The train-chosen filter (compressed prior day) went negative in 2026 (−3.2). |
| P7 RSI(14) 30/70 reversal | 222 / -3.0 | 160 / +0.5 | 28% | 5,558 | 95 | 0.45 | 0.67 | -6.4 / -0.9 / -9.2 / -4.0 / +3.1 | 8/20 · 4/9 | No. The train-chosen filter (compressed prior day) was −8.0 in 2026, worse than always-on. On spot, no filter qualified in 2025–26. |
| P8 Gap fade (gap-fill) | 46 / -19.7 | 39 / -3.1 | 28% | -7,977 | 55 | 0.62 | 0.71 | -4.0 / -16.7 / +16.9 / -36.2 / -2.3 | 7/20 · 2/9 | No. No filter qualified on train. The M20 switch was +26 in 2026, but on only 8 trades. |
Percentile vs random: 2026 mean compared with 2000 sets of random-day entries at the same minute, direction and R, with the same exit (50 = no better than random). Spot net = index points minus 1 pt. VWAP-based P4–P6 start Oct-2024 because futures volume is missing before that. Positive quarters: spot 2022–26 · options Q4-2024–Q4-2026.
How it was tested (pre-declared). Every label is known before 09:15. Rule: on the training window, keep the buckets of one label where the strategy averaged above 0 (with at least 10 option trades or 15 spot trades per bucket). Pick the label with the highest training total. Apply it unchanged to the next period. Options: train Oct-2024–Dec-2025 → test 2026. Spot: expanding walk-forward (train 2022..Y → test Y+1; OOS 2023–2026; the requested 2017 start is impossible because no intraday data before 2022 exists). Meta-switch M20: trade only if the strategy's last 20 completed trades summed above 0. BH over the declared family of 32 tests. A regime edge counts only if q<0.10, the OOS filtered mean beats always-on, and it beats ≥90% of random same-size subsets.
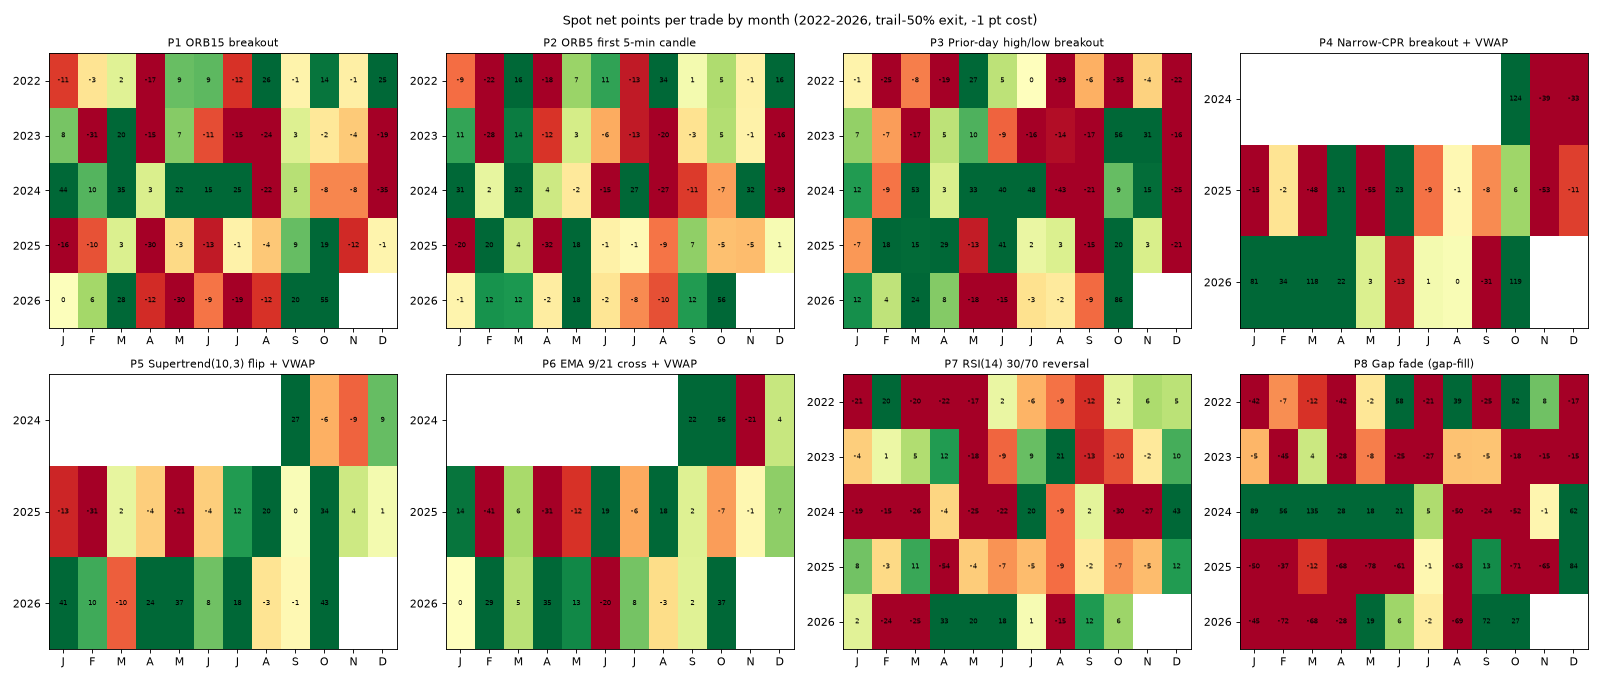
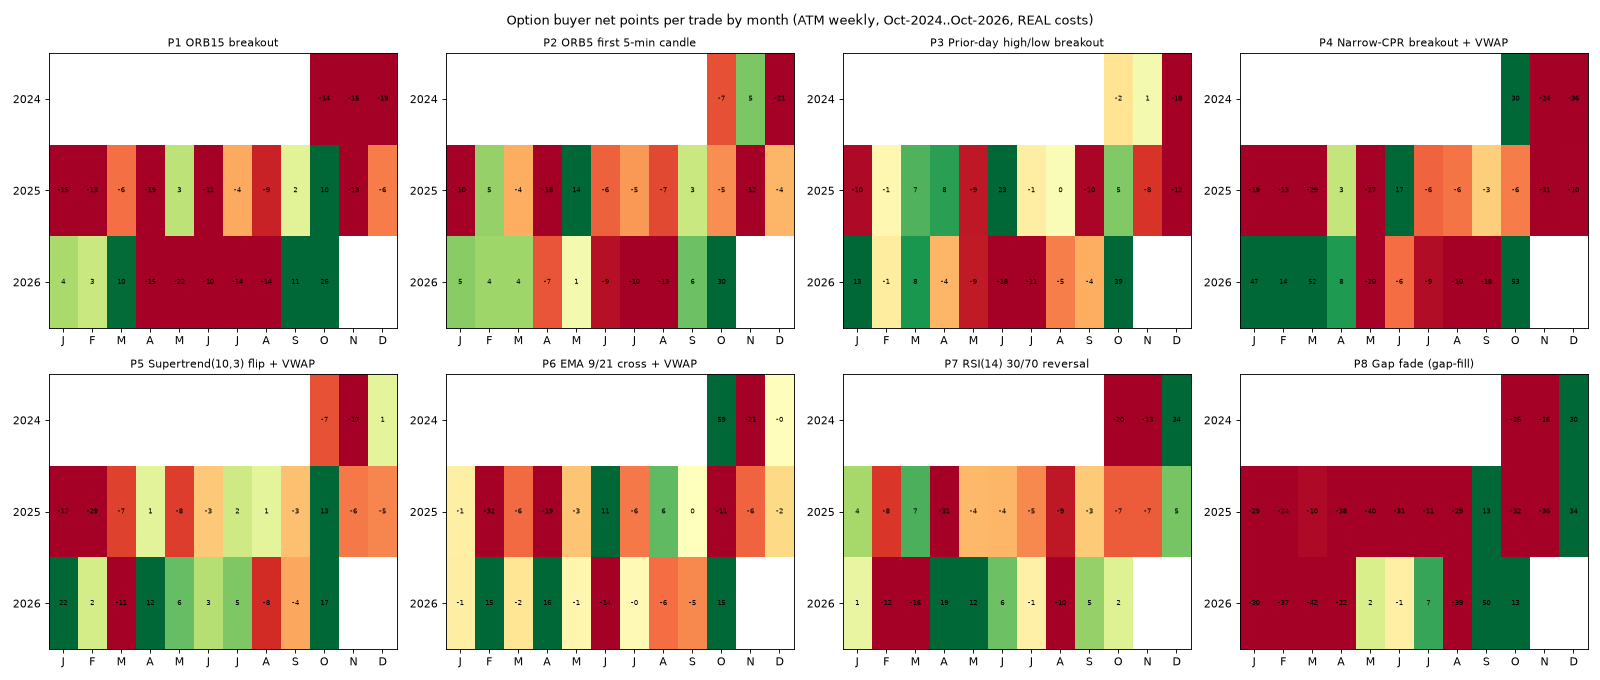
Overfitting disclosure. 8 labels × 23 buckets × 8 strategies × 2 datasets, 713 bucket cells (all shown in regime_buckets.csv). With this many cuts, plenty of buckets look great in hindsight. In the heatmaps below, many cells are green on train and a largely different set is green in 2026. That is why only out-of-sample results count.
| test | cand | rule | train_n | train_mean | oos_n | oos_mean | always_mean | p | q_bh | pctile_vs_random_subsets | pctile_vs_random_entries_same_regime | edge_counts? |
|---|---|---|---|---|---|---|---|---|---|---|---|---|
| opt_regime | P1 | no filter found on train | – | – | 0 | – | -3.22 | 1.00 | 1.00 | – | – | False |
| opt_regime | P2 | L5_NR7 in ['NR7'] | 42.00 | 2.11 | 29 | 28.34 | -0.04 | 0.03 | 0.34 | 99.30 | 99.70 | False |
| opt_regime | P3 | L5_NR7 in ['NR7'] | 23.00 | 7.93 | 15 | 22.98 | 0.89 | 0.10 | 0.39 | 98.45 | 96.85 | False |
| opt_regime | P4 | L5_NR7 in ['NR7'] | 25.00 | 1.90 | 18 | 23.69 | 4.78 | 0.05 | 0.34 | 97.95 | 90.75 | False |
| opt_regime | P5 | L3_ER20 in ['mid0.2-0.4'] | 47.00 | 6.46 | 33 | 11.86 | 4.43 | 0.13 | 0.43 | 81.85 | 85.40 | False |
| opt_regime | P6 | L4_PDR in ['compressed<0.8'] | 75.00 | 0.98 | 50 | -3.16 | 0.84 | 0.69 | 0.87 | 24.05 | 27.05 | False |
| opt_regime | P7 | L4_PDR in ['compressed<0.8'] | 82.00 | 3.11 | 55 | -7.99 | 0.53 | 0.93 | 1.00 | 5.55 | 9.05 | False |
| opt_regime | P8 | no filter found on train | – | – | 0 | – | -3.15 | 1.00 | 1.00 | – | – | False |
| spot_walkforward | P1 | walk-forward (see wf table) | – | – | 428 | 1.47 | -0.97 | 0.36 | 0.86 | 77.55 | – | False |
| spot_walkforward | P2 | walk-forward (see wf table) | – | – | 298 | 0.65 | -0.00 | 0.45 | 0.86 | 58.00 | – | False |
| spot_walkforward | P3 | walk-forward (see wf table) | – | – | 277 | 5.49 | 4.51 | 0.09 | 0.39 | 67.05 | – | False |
| spot_walkforward | P4 | walk-forward (see wf table) | – | – | 28 | 33.02 | 2.90 | 0.01 | 0.30 | 98.40 | – | False |
| spot_walkforward | P5 | walk-forward (see wf table) | – | – | 33 | 30.25 | 7.72 | 0.05 | 0.34 | 93.80 | – | False |
| spot_walkforward | P6 | walk-forward (see wf table) | – | – | 112 | 15.25 | 3.22 | 0.04 | 0.34 | 97.70 | – | False |
| spot_walkforward | P7 | walk-forward (see wf table) | – | – | 142 | -4.08 | -2.84 | 0.75 | 0.87 | 41.30 | – | False |
| spot_walkforward | P8 | walk-forward (see wf table) | – | – | 88 | -3.60 | -7.03 | 0.64 | 0.86 | 67.25 | – | False |
| opt_M20 | P1 | M20 | – | – | 50 | -0.28 | -3.22 | 0.51 | 0.86 | 66.25 | – | False |
| spot_M20 | P1 | M20 | – | – | 366 | -1.38 | -0.97 | 0.62 | 0.86 | 44.15 | – | False |
| opt_M20 | P2 | M20 | – | – | 74 | -5.62 | -0.04 | 0.76 | 0.87 | 16.35 | – | False |
| spot_M20 | P2 | M20 | – | – | 418 | -7.34 | -0.00 | 0.95 | 1.00 | 1.20 | – | False |
| opt_M20 | P3 | M20 | – | – | 25 | 0.52 | 0.89 | 0.47 | 0.86 | 49.25 | – | False |
| spot_M20 | P3 | M20 | – | – | 221 | 0.90 | 4.51 | 0.42 | 0.86 | 11.00 | – | False |
| opt_M20 | P4 | M20 | – | – | 28 | -0.64 | 4.78 | 0.54 | 0.86 | 19.00 | – | False |
| spot_M20 | P4 | M20 | – | – | 41 | 15.32 | 5.06 | 0.08 | 0.39 | 81.60 | – | False |
| opt_M20 | P5 | M20 | – | – | 81 | -1.62 | 4.43 | 0.64 | 0.86 | 4.00 | – | False |
| spot_M20 | P5 | M20 | – | – | 166 | 6.49 | 6.75 | 0.15 | 0.43 | 47.40 | – | False |
| opt_M20 | P6 | M20 | – | – | 68 | -4.60 | 0.84 | 0.74 | 0.87 | 11.10 | – | False |
| spot_M20 | P6 | M20 | – | – | 196 | 0.88 | 4.70 | 0.44 | 0.86 | 15.65 | – | False |
| opt_M20 | P7 | M20 | – | – | 84 | -0.99 | 0.53 | 0.57 | 0.86 | 34.45 | – | False |
| spot_M20 | P7 | M20 | – | – | 316 | -1.26 | -2.84 | 0.65 | 0.86 | 74.50 | – | False |
| opt_M20 | P8 | M20 | – | – | 8 | 26.39 | -3.15 | 0.20 | 0.55 | 91.00 | – | False |
| spot_M20 | P8 | M20 | – | – | 58 | 17.86 | -7.03 | 0.12 | 0.41 | 99.35 | – | False |
| cand | test_year | rule | train_n | train_mean | oos_n | oos_mean | always_mean |
|---|---|---|---|---|---|---|---|
| P1 | 2023 | L7_Expiry in ['day_before', 'expiry_day'] | 102 | 13.01 | 93 | -1.87 | -6.55 |
| P1 | 2024 | L7_Expiry in ['day_before', 'expiry_day'] | 195 | 5.91 | 99 | 4.94 | 6.95 |
| P1 | 2025 | L4_PDR in ['compressed<0.8', 'normal'] | 503 | 4.78 | 174 | -2.05 | -5.03 |
| P1 | 2026 | L4_PDR in ['compressed<0.8'] | 344 | 6.21 | 62 | 10.80 | 0.96 |
| P2 | 2023 | L7_Expiry in ['expiry_day'] | 50 | 24.91 | 51 | -5.92 | -5.44 |
| P2 | 2024 | L7_Expiry in ['day_before', 'expiry_day'] | 199 | 5.80 | 101 | 6.24 | 1.74 |
| P2 | 2025 | L7_Expiry in ['day_before', 'expiry_day'] | 300 | 5.95 | 105 | -5.70 | -1.93 |
| P2 | 2026 | L7_Expiry in ['expiry_day'] | 204 | 6.45 | 41 | 11.34 | 7.00 |
| P3 | 2023 | L8_FII_long in ['25-45%', '<25%'] | 36 | 1.15 | 48 | 3.36 | -0.09 |
| P3 | 2024 | L4_PDR in ['compressed<0.8'] | 60 | 4.53 | 52 | 10.21 | 8.17 |
| P3 | 2025 | L8_FII_long in ['25-45%', '<25%'] | 145 | 9.96 | 103 | 2.37 | 3.20 |
| P3 | 2026 | L8_FII_long in ['25-45%', '<25%'] | 248 | 6.80 | 74 | 7.90 | 7.90 |
| P4 | 2025 | none (trade nothing) | 9 | – | 0 | – | -11.09 |
| P4 | 2026 | L4_PDR in ['compressed<0.8'] | 53 | 2.29 | 28 | 33.02 | 22.09 |
| P5 | 2025 | none (trade nothing) | 25 | – | 0 | – | -0.20 |
| P5 | 2026 | L3_ER20 in ['mid0.2-0.4'] | 49 | 14.59 | 33 | 30.25 | 16.86 |
| P6 | 2025 | none (trade nothing) | 30 | – | 0 | – | -1.61 |
| P6 | 2026 | L2_DMA_trend in ['down', 'mixed'] | 117 | 9.53 | 112 | 15.25 | 9.02 |
| P7 | 2023 | L5_NR7 in ['NR7'] | 36 | 3.54 | 33 | -6.47 | -0.91 |
| P7 | 2024 | L1_VIX in ['13-16'] | 72 | 5.08 | 109 | -3.36 | -9.22 |
| P7 | 2025 | none (trade nothing) | 558 | – | 0 | – | -3.98 |
| P7 | 2026 | none (trade nothing) | 746 | – | 0 | – | 3.09 |
| P8 | 2023 | L4_PDR in ['compressed<0.8', 'normal'] | 55 | 10.02 | 29 | -17.44 | -16.67 |
| P8 | 2024 | L7_Expiry in ['day_before', 'expiry_day'] | 51 | 26.00 | 25 | 22.65 | 16.85 |
| P8 | 2025 | L7_Expiry in ['day_before', 'expiry_day'] | 76 | 24.90 | 18 | -44.60 | -36.18 |
| P8 | 2026 | L7_Expiry in ['day_before', 'expiry_day'] | 94 | 11.59 | 16 | 26.57 | -2.26 |
The chosen label changes almost every year for P1, P2, P3, P7 and P8. A regime that has to be re-picked every year is not a stable property of the strategy.
| data | cand | 8w | M20 | M40 | always_mean |
|---|---|---|---|---|---|
| options_2026 | P1 | 6.63 | -0.28 | 2.90 | -3.22 |
| options_2026 | P2 | -2.85 | -5.62 | -6.78 | -0.04 |
| options_2026 | P3 | 0.98 | 0.52 | -12.10 | 0.89 |
| options_2026 | P4 | 18.92 | -0.64 | -4.93 | 4.78 |
| options_2026 | P5 | -2.56 | -1.62 | -1.16 | 4.43 |
| options_2026 | P6 | 1.71 | -4.60 | -1.80 | 0.84 |
| options_2026 | P7 | -3.21 | -0.99 | -0.72 | 0.53 |
| options_2026 | P8 | -2.01 | 26.39 | – | -3.15 |
| spot_2023_26 | P1 | 0.90 | -1.38 | 0.16 | -0.97 |
| spot_2023_26 | P2 | -5.45 | -7.34 | -6.39 | -0.00 |
| spot_2023_26 | P3 | 4.34 | 0.90 | -0.85 | 4.51 |
| spot_2023_26 | P4 | 2.24 | 15.32 | 13.37 | 5.06 |
| spot_2023_26 | P5 | 3.89 | 6.49 | 13.51 | 6.75 |
| spot_2023_26 | P6 | 4.39 | 0.88 | 0.27 | 4.70 |
| spot_2023_26 | P7 | -0.65 | -1.26 | -3.98 | -2.84 |
| spot_2023_26 | P8 | 9.41 | 17.86 | 5.11 | -7.03 |
M20 / M40 = last 20 / 40 trades net positive. 8w = last 8 weeks net positive. Only M20 is in the family; M40 and 8w are secondary. Turning a strategy off after losses mostly misses the rebounds: these strategies mean-revert in performance rather than trend.
| year | size_NR7 | size_no | mean_NR7 | mean_no |
|---|---|---|---|---|
| 2022 | 91 | 460 | 13.35 | -0.52 |
| 2023 | 90 | 474 | -2.02 | -5.46 |
| 2024 | 106 | 465 | -10.57 | 8.52 |
| 2025 | 82 | 497 | 8.36 | -4.01 |
| 2026 | 72 | 374 | 49.86 | -4.01 |
| year | size_NR7 | size_no | mean_NR7 | mean_no |
|---|---|---|---|---|
| 2024 | 23 | 86 | 2.76 | -14.51 |
| 2025 | 82 | 495 | 1.47 | -5.95 |
| 2026 | 72 | 372 | 22.80 | -5.83 |
Spot net pts per trade by year. NR7 beat non-NR7 days in 2022, 2023, 2025 and 2026, and lost in 2024. The 2026 gap (+50 vs −4) is far larger than in any earlier year, so expect it to shrink. To watch going forward: log every NR7-day ORB/PDH breakout from 27-Oct-2026 and re-check after about 40 trades.
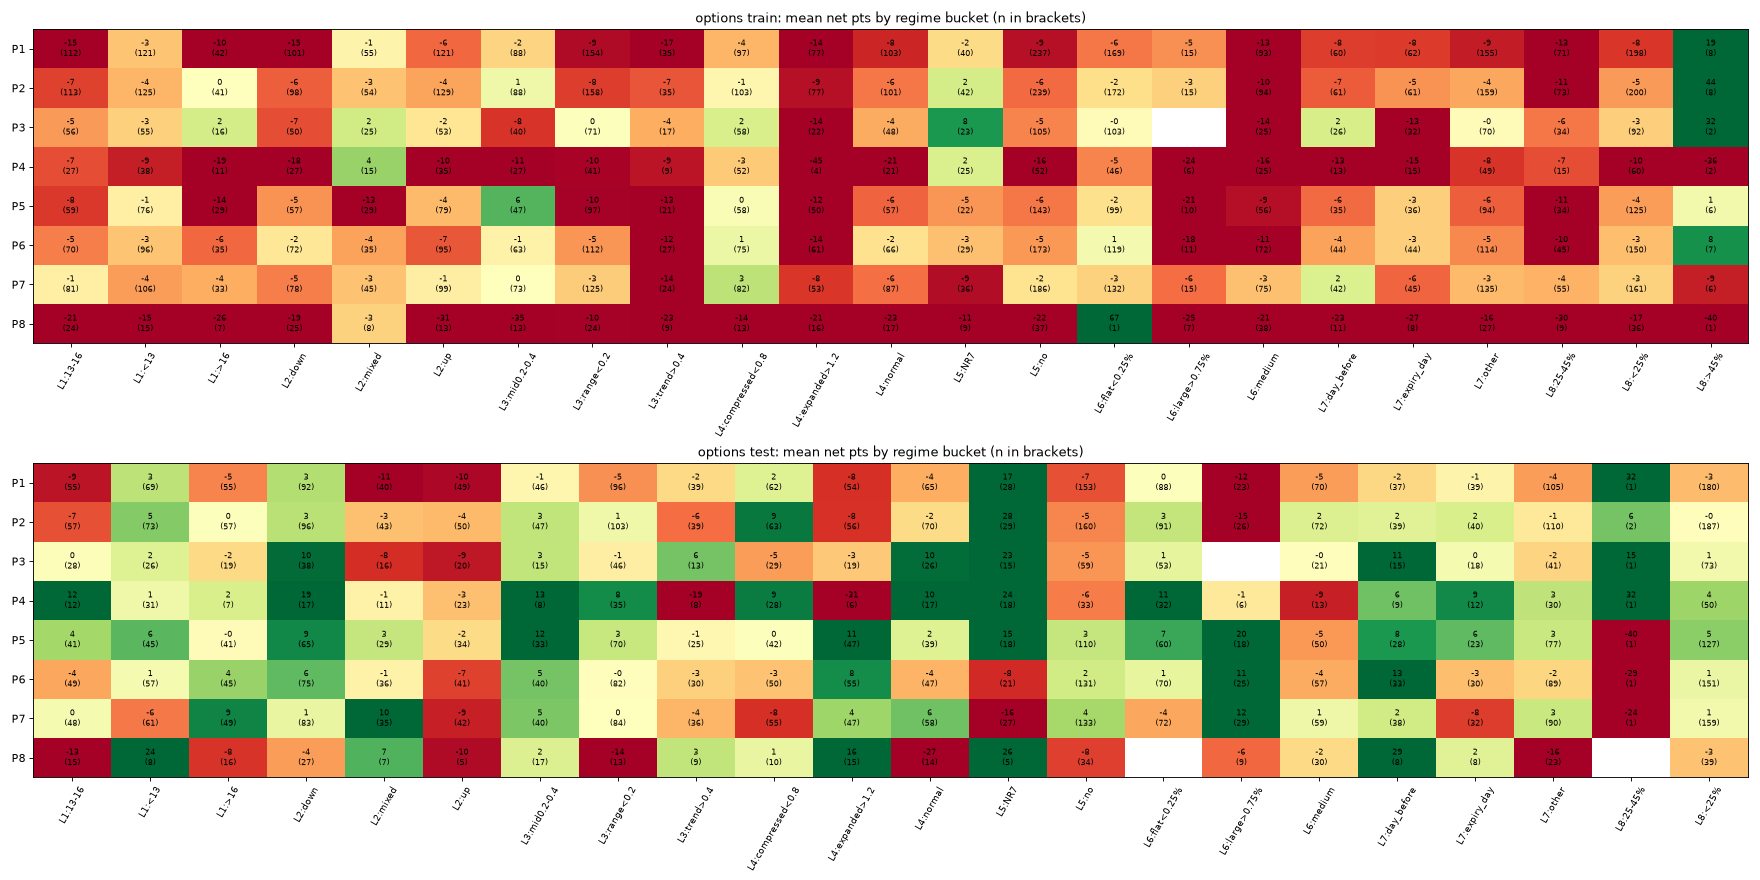
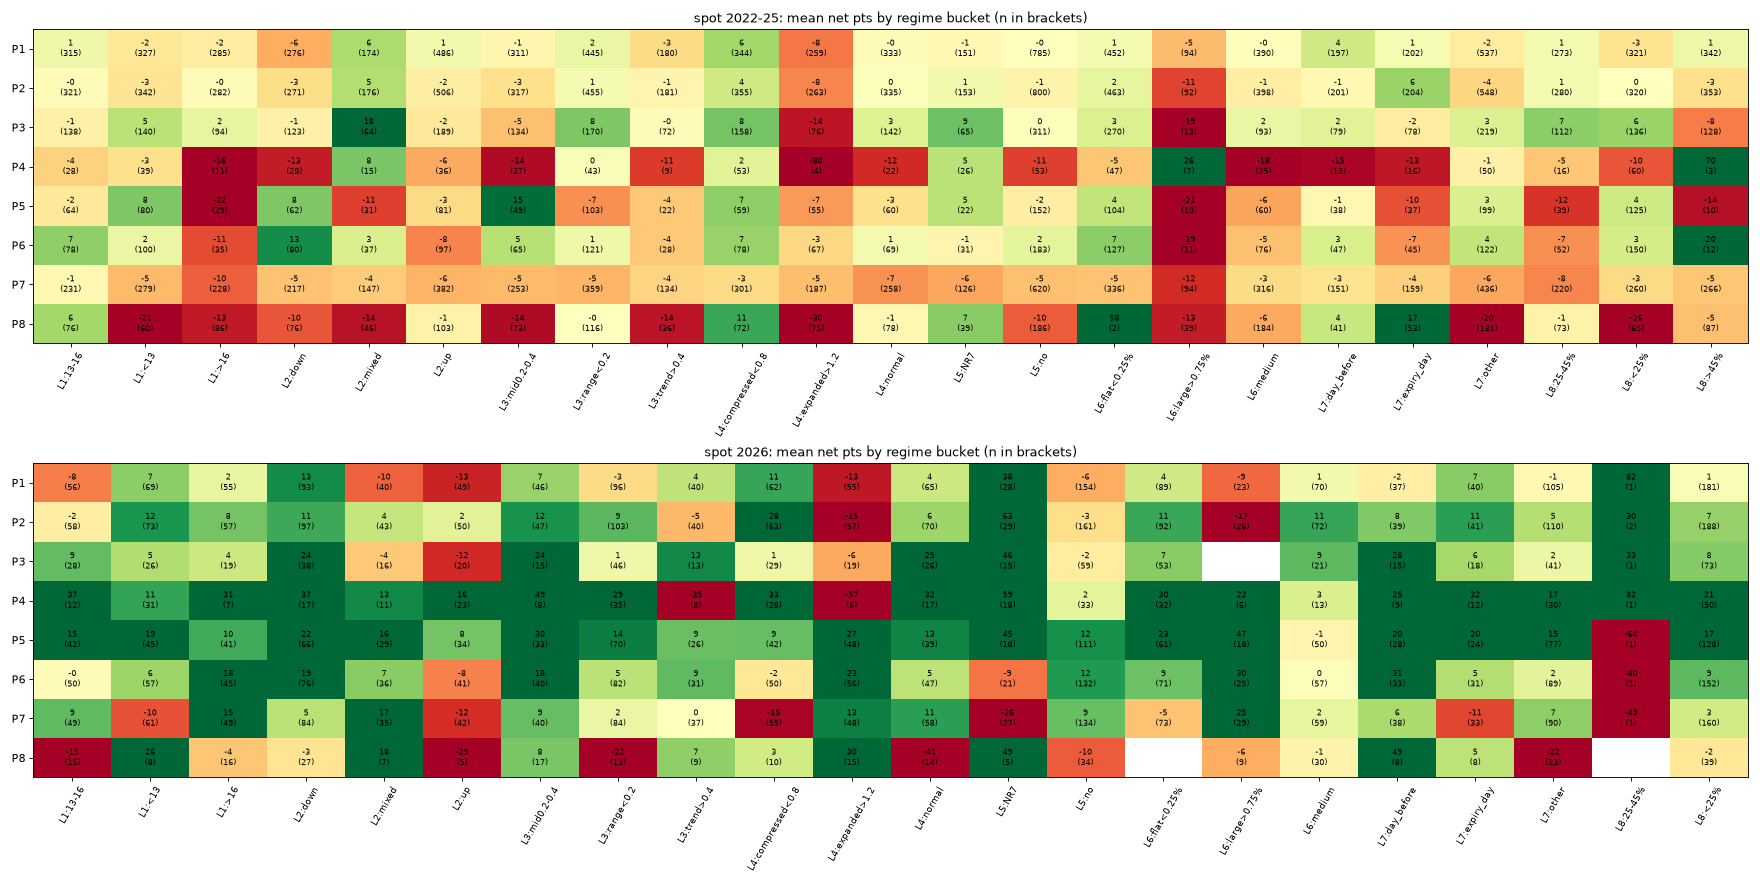
| label | bucket | P1_test | P1_train | P2_test | P2_train | P3_test | P3_train | P4_test | P4_train | P5_test | P5_train | P6_test | P6_train | P7_test | P7_train | P8_test | P8_train |
|---|---|---|---|---|---|---|---|---|---|---|---|---|---|---|---|---|---|
| L1_VIX | 13-16 | -9.1 | -14.6 | -6.9 | -7.4 | 0.2 | -4.6 | 12.1 | -7.0 | 4.0 | -7.7 | -4.2 | -5.4 | 0.5 | -1.0 | -12.8 | -20.8 |
| L1_VIX | <13 | 3.1 | -3.1 | 5.0 | -3.6 | 1.7 | -2.6 | 0.8 | -8.7 | 6.2 | -0.9 | 0.5 | -3.1 | -5.6 | -4.5 | 24.3 | -14.9 |
| L1_VIX | >16 | -5.3 | -10.3 | 0.2 | 0.0 | -2.2 | 2.2 | 2.0 | -19.3 | -0.3 | -13.9 | 4.4 | -6.2 | 8.8 | -4.0 | -7.9 | -26.2 |
| L2_DMA_trend | down | 3.5 | -14.9 | 3.2 | -6.4 | 9.8 | -7.0 | 19.3 | -18.2 | 8.6 | -4.8 | 6.1 | -1.5 | 1.2 | -5.4 | -4.5 | -19.1 |
| L2_DMA_trend | mixed | -10.8 | -0.8 | -3.3 | -3.2 | -8.1 | 2.3 | -0.8 | 4.4 | 2.8 | -12.7 | -0.8 | -4.4 | 10.0 | -3.1 | 6.5 | -2.5 |
| L2_DMA_trend | up | -9.6 | -6.1 | -3.5 | -4.3 | -9.0 | -1.6 | -3.2 | -10.1 | -2.2 | -3.5 | -7.4 | -6.6 | -8.6 | -1.1 | -9.5 | -31.4 |
| L3_ER20 | mid0.2-0.4 | -0.6 | -2.5 | 2.9 | 0.8 | 2.9 | -7.9 | 12.7 | -10.9 | 11.9 | 6.5 | 5.5 | -0.8 | 5.3 | 0.0 | 1.8 | -35.4 |
| L3_ER20 | range<0.2 | -4.9 | -9.5 | 0.8 | -7.5 | -1.1 | 0.1 | 8.5 | -9.8 | 2.7 | -9.9 | -0.2 | -4.8 | 0.0 | -2.8 | -13.8 | -9.9 |
| L3_ER20 | trend>0.4 | -2.2 | -17.4 | -6.0 | -6.8 | 5.5 | -3.9 | -19.3 | -9.1 | -0.5 | -12.6 | -2.6 | -11.5 | -3.6 | -13.6 | 2.9 | -23.1 |
| L4_PDR | compressed<0.8 | 1.7 | -3.6 | 9.3 | -0.6 | -4.5 | 2.0 | 9.1 | -2.9 | 0.1 | 0.4 | -3.2 | 1.0 | -8.0 | 3.1 | 1.1 | -14.1 |
| L4_PDR | expanded>1.2 | -8.0 | -13.9 | -7.9 | -9.3 | -2.9 | -13.7 | -31.0 | -44.6 | 10.6 | -11.6 | 8.4 | -13.9 | 4.2 | -7.8 | 16.4 | -21.2 |
| L4_PDR | normal | -3.9 | -8.4 | -2.1 | -5.7 | 9.7 | -4.0 | 10.2 | -21.4 | 1.7 | -6.3 | -3.7 | -1.8 | 5.7 | -5.9 | -27.1 | -22.6 |
| L5_NR7 | NR7 | 17.0 | -2.2 | 28.3 | 2.1 | 23.0 | 7.9 | 23.7 | 1.9 | 14.5 | -4.7 | -8.3 | -3.2 | -16.2 | -9.4 | 26.5 | -11.2 |
| L5_NR7 | no | -6.9 | -9.3 | -5.2 | -6.0 | -4.7 | -5.3 | -5.5 | -15.9 | 2.8 | -5.7 | 2.3 | -4.6 | 3.9 | -1.8 | -7.5 | -21.8 |
| L6_Gap | flat<0.25% | 0.1 | -5.7 | 2.8 | -2.0 | 1.3 | -0.3 | 11.4 | -5.2 | 7.2 | -1.9 | 1.2 | 0.6 | -4.2 | -2.6 | – | 67.3 |
| L6_Gap | large>0.75% | -12.0 | -4.9 | -15.0 | -2.6 | – | – | -1.4 | -24.4 | 20.5 | -20.6 | 10.9 | -18.3 | 11.5 | -6.0 | -6.2 | -25.1 |
| L6_Gap | medium | -4.5 | -13.4 | 1.7 | -10.4 | -0.1 | -13.8 | -8.6 | -15.6 | -4.6 | -9.3 | -4.0 | -10.6 | 0.9 | -3.2 | -2.2 | -21.0 |
| L7_Expiry | day_before | -2.3 | -7.5 | 1.6 | -6.6 | 10.6 | 2.0 | 5.7 | -12.6 | 7.9 | -6.1 | 13.3 | -4.4 | 2.3 | 1.8 | 28.8 | -22.6 |
| L7_Expiry | expiry_day | -0.7 | -7.6 | 2.0 | -4.8 | 0.5 | -12.7 | 8.5 | -15.3 | 6.1 | -2.7 | -3.3 | -2.7 | -7.5 | -6.2 | 1.6 | -27.1 |
| L7_Expiry | other | -4.5 | -8.8 | -1.4 | -4.2 | -2.5 | -0.3 | 3.0 | -7.8 | 2.6 | -6.5 | -2.4 | -5.1 | 2.6 | -3.5 | -15.9 | -16.3 |
| L8_FII_long | 25-45% | 31.9 | -12.5 | 5.5 | -10.9 | 15.1 | -5.7 | 31.9 | -7.0 | -39.6 | -10.7 | -28.7 | -10.1 | -23.8 | -3.8 | – | -30.1 |
| L8_FII_long | <25% | -3.4 | -7.8 | -0.1 | -4.5 | 0.7 | -2.7 | 4.2 | -10.0 | 4.8 | -4.5 | 1.0 | -3.3 | 0.7 | -2.6 | -3.2 | -16.5 |
| L8_FII_long | >45% | – | 18.8 | – | 43.9 | – | 31.9 | – | -35.6 | – | 0.7 | – | 8.2 | – | -8.7 | – | -39.5 |
| cand | 2024 | 2025 | 2026 |
|---|---|---|---|
| P1 | -16.4 | -6.8 | -3.2 |
| P2 | -8.0 | -4.2 | -0.0 |
| P3 | -6.1 | -2.2 | 0.9 |
| P4 | -10.4 | -10.1 | 4.8 |
| P5 | -10.8 | -5.0 | 4.4 |
| P6 | 0.1 | -4.9 | 0.8 |
| P7 | 2.9 | -4.1 | 0.5 |
| P8 | -13.3 | -21.0 | -3.2 |
| cand | 2024H2 | 2025H1 | 2025H2 | 2026H1 | 2026H2 |
|---|---|---|---|---|---|
| P1 | -16.4 | -10.3 | -3.2 | -5.2 | -0.0 |
| P2 | -8.0 | -3.6 | -4.9 | -0.5 | 0.6 |
| P3 | -6.1 | -0.2 | -4.0 | -1.0 | 3.5 |
| P4 | -10.4 | -11.7 | -8.7 | 16.6 | -5.0 |
| P5 | -10.8 | -9.6 | -0.3 | 6.3 | 1.0 |
| P6 | 0.1 | -7.3 | -2.6 | 1.9 | -0.8 |
| P7 | 2.9 | -4.6 | -3.8 | 1.9 | -1.4 |
| P8 | -13.3 | -26.7 | -10.2 | -15.4 | 18.7 |
| cand | 2024Q4 | 2025Q1 | 2025Q2 | 2025Q3 | 2025Q4 | 2026Q1 | 2026Q2 | 2026Q3 | 2026Q4 |
|---|---|---|---|---|---|---|---|---|---|
| P1 | -16.4 | -11.5 | -8.8 | -3.8 | -2.7 | 5.1 | -15.2 | -6.0 | 26.0 |
| P2 | -8.0 | -3.7 | -3.5 | -3.0 | -6.8 | 4.4 | -5.4 | -6.2 | 29.8 |
| P3 | -6.1 | -3.0 | 4.6 | -3.7 | -4.2 | 7.0 | -10.2 | -6.8 | 38.9 |
| P4 | -10.4 | -17.5 | -5.8 | -4.6 | -13.8 | 29.8 | -7.9 | -12.0 | 53.3 |
| P5 | -10.8 | -16.2 | -3.6 | 0.0 | -0.7 | 5.8 | 6.7 | -2.0 | 17.0 |
| P6 | 0.1 | -12.5 | -2.7 | 0.3 | -6.2 | 5.0 | -0.8 | -3.7 | 14.9 |
| P7 | 2.9 | 1.3 | -10.7 | -5.4 | -2.2 | -9.6 | 12.7 | -2.2 | 1.7 |
| P8 | -13.3 | -22.6 | -37.0 | -3.5 | -21.0 | -37.1 | -5.2 | 22.9 | 13.2 |
| cand | 2022 | 2023 | 2024 | 2025 | 2026 |
|---|---|---|---|---|---|
| P1 | 3.6 | -6.6 | 7.0 | -5.0 | 1.0 |
| P2 | 2.5 | -5.4 | 1.7 | -1.9 | 7.0 |
| P3 | -6.8 | -0.1 | 8.2 | 3.2 | 7.9 |
| P4 | – | – | 34.2 | -11.1 | 22.1 |
| P5 | – | – | -4.0 | -0.2 | 16.9 |
| P6 | – | – | 21.4 | -1.6 | 9.0 |
| P7 | -6.4 | -0.9 | -9.2 | -4.0 | 3.1 |
| P8 | -4.0 | -16.7 | 16.8 | -36.2 | -2.3 |
| cand | 2022H1 | 2022H2 | 2023H1 | 2023H2 | 2024H1 | 2024H2 | 2025H1 | 2025H2 | 2026H1 | 2026H2 |
|---|---|---|---|---|---|---|---|---|---|---|
| P1 | -1.3 | 8.5 | -2.6 | -10.7 | 21.6 | -6.6 | -11.6 | 1.5 | -3.1 | 7.4 |
| P2 | -2.2 | 7.0 | -2.5 | -8.5 | 8.6 | -5.0 | -2.2 | -1.7 | 5.9 | 8.7 |
| P3 | -2.6 | -12.4 | 0.2 | -0.4 | 23.8 | -5.4 | 8.7 | -1.6 | 2.0 | 16.1 |
| P4 | – | – | – | – | – | 34.2 | -11.4 | -10.8 | 40.9 | 6.6 |
| P5 | – | – | – | – | – | -4.0 | -10.7 | 10.5 | 20.0 | 11.1 |
| P6 | – | – | – | – | – | 21.4 | -6.2 | 2.8 | 9.8 | 7.8 |
| P7 | -9.9 | -2.7 | -2.8 | 1.1 | -18.1 | -0.5 | -5.9 | -2.4 | 4.7 | 0.9 |
| P8 | -5.0 | -2.8 | -18.0 | -15.2 | 49.2 | -22.8 | -44.4 | -19.8 | -18.5 | 26.7 |
| cand | 2022Q1 | 2022Q2 | 2022Q3 | 2022Q4 | 2023Q1 | 2023Q2 | 2023Q3 | 2023Q4 | 2024Q1 | 2024Q2 | 2024Q3 | 2024Q4 | 2025Q1 | 2025Q2 | 2025Q3 | 2025Q4 | 2026Q1 | 2026Q2 | 2026Q3 | 2026Q4 |
|---|---|---|---|---|---|---|---|---|---|---|---|---|---|---|---|---|---|---|---|---|
| P1 | -3.8 | 1.0 | 4.0 | 13.2 | -0.6 | -4.9 | -12.3 | -8.8 | 29.2 | 13.3 | 3.1 | -17.0 | -8.2 | -15.4 | 1.0 | 1.9 | 10.5 | -16.2 | -3.5 | 55.1 |
| P2 | -4.9 | 0.4 | 7.0 | 7.0 | -0.7 | -4.4 | -12.2 | -4.2 | 21.1 | -4.2 | -3.0 | -7.2 | 0.1 | -4.4 | -0.5 | -3.0 | 7.8 | 4.0 | -2.2 | 56.4 |
| P3 | -10.3 | 8.3 | -9.0 | -17.2 | -3.1 | 3.8 | -15.8 | 20.6 | 20.7 | 27.2 | -14.1 | 1.0 | 5.9 | 13.5 | -4.3 | 0.9 | 12.2 | -9.7 | -4.3 | 85.9 |
| P4 | – | – | – | – | – | – | – | – | – | – | – | 34.2 | -13.8 | -9.0 | -5.9 | -16.9 | 58.4 | 8.0 | -6.9 | 119.4 |
| P5 | – | – | – | – | – | – | – | – | – | – | 26.8 | -5.3 | -11.4 | -10.1 | 10.3 | 10.7 | 16.4 | 23.2 | 5.3 | 43.4 |
| P6 | – | – | – | – | – | – | – | – | – | – | 21.8 | 21.4 | -5.9 | -6.5 | 4.9 | 0.2 | 12.7 | 7.2 | 2.6 | 36.8 |
| P7 | -6.1 | -13.4 | -8.7 | 4.1 | 0.7 | -6.2 | 3.5 | -0.9 | -20.1 | -16.1 | 3.4 | -4.0 | 5.7 | -18.3 | -5.1 | 0.3 | -16.2 | 24.3 | -0.5 | 6.4 |
| P8 | -17.5 | 7.6 | -12.6 | 9.7 | -17.3 | -19.3 | -14.3 | -16.4 | 84.8 | 23.0 | -22.5 | -23.1 | -35.5 | -68.3 | -9.5 | -36.4 | -60.2 | 1.2 | 26.7 | 26.6 |
| cand | test | train |
|---|---|---|
| P1 | -4.36 | -8.65 |
| P2 | -0.68 | -5.29 |
| P3 | 1.07 | -6.21 |
| P4 | 4.18 | -10.56 |
| P5 | 3.80 | -6.35 |
| P6 | 0.88 | -6.77 |
| P7 | -0.32 | -3.55 |
| P8 | -6.28 | -20.20 |
Added after Satya's 21:13 IST question: “what about combination of strategies there probability increases right”. Pre-registered at 21:14 IST in PREREG.md before any combo result. Same data, costs, exit, random benchmark and train/test split. A combo trade is the trade of the confirming (later) signal, one per day. Honesty flag: the NR7 combos (N*) reuse a filter whose 2026 result was already seen, so they are not clean out-of-sample.
Common window 21-Oct-2024 to 23-Oct-2026 (496 days). Signal days: P1 463, P2 474, P3 204, P4 128, P5 294, P6 355, P7 387, P8 86. Cell = % of days the row strategy fired on which the column strategy fired in the same direction.
| if ↓ fires | P1 | P2 | P3 | P4 | P5 | P6 | P7 | P8 |
|---|---|---|---|---|---|---|---|---|
| P1 | 100 | 89 | 36 | 21 | 27 | 34 | 21 | 17 |
| P2 | 87 | 100 | 34 | 21 | 24 | 33 | 24 | 16 |
| P3 | 82 | 78 | 100 | 29 | 21 | 24 | 8 | 5 |
| P4 | 75 | 77 | 46 | 100 | 15 | 21 | 16 | 2 |
| P5 | 43 | 39 | 14 | 6 | 100 | 84 | 54 | 19 |
| P6 | 45 | 44 | 14 | 8 | 70 | 100 | 50 | 17 |
| P7 | 25 | 29 | 4 | 5 | 41 | 46 | 100 | 12 |
| P8 | 90 | 86 | 13 | 3 | 64 | 72 | 56 | 100 |
ORB15 and ORB5 fire the same way on 87–89% of each other's days. When P3 (PDH/PDL) or P4 (CPR) fires, ORB15/ORB5 fire the same way on 75–82% of those days. The indicator group (P5 Supertrend, P6 EMA) agrees 70–84%. P8 (gap fade) is the ORB15 trade 90% of the time. When two of them “agree”, it is usually the same price move counted twice, not two independent confirmations. Option P&L on same-direction co-fire days is also highly correlated (P1–P2 0.91; P1–P8 1.00):
| if ↓ fires | P1 | P2 | P3 | P4 | P5 | P6 | P7 | P8 |
|---|---|---|---|---|---|---|---|---|
| P1 | – | 0.91 | 0.52 | 0.86 | 0.43 | 0.73 | 0.66 | 1.00 |
| P2 | 0.91 | – | 0.58 | 0.79 | 0.65 | 0.72 | 0.71 | 0.94 |
| P3 | 0.52 | 0.58 | – | 0.72 | 0.28 | 0.40 | 0.57 | 0.22 |
| P4 | 0.86 | 0.79 | 0.72 | – | 0.14 | 0.42 | -0.10 | – |
| P5 | 0.43 | 0.65 | 0.28 | 0.14 | – | 0.76 | 0.60 | 0.65 |
| P6 | 0.73 | 0.72 | 0.40 | 0.42 | 0.76 | – | 0.57 | 0.72 |
| P7 | 0.66 | 0.71 | 0.57 | -0.10 | 0.60 | 0.57 | – | 0.84 |
| P8 | 1.00 | 0.94 | 0.22 | – | 0.65 | 0.72 | 0.84 | – |
| if ↓ fires | P1 | P2 | P3 | P4 | P5 | P6 | P7 | P8 |
|---|---|---|---|---|---|---|---|---|
| P1 | 0 | 9 | 7 | 5 | 32 | 36 | 57 | 2 |
| P2 | 9 | 0 | 9 | 5 | 35 | 38 | 54 | 3 |
| P3 | 16 | 20 | 0 | 5 | 35 | 41 | 76 | 3 |
| P4 | 18 | 20 | 8 | 0 | 45 | 52 | 66 | 9 |
| P5 | 51 | 56 | 24 | 20 | 0 | 10 | 21 | 2 |
| P6 | 48 | 51 | 23 | 19 | 8 | 0 | 23 | 3 |
| P7 | 68 | 66 | 40 | 22 | 16 | 21 | 0 | 3 |
| P8 | 10 | 14 | 8 | 14 | 8 | 14 | 15 | 0 |
| if ↓ fires | P1 | P2 | P3 | P4 | P5 | P6 | P7 | P8 |
|---|---|---|---|---|---|---|---|---|
| P1 | 1.00 | 0.81 | 0.68 | 0.61 | -0.09 | -0.03 | -0.46 | 0.79 |
| P2 | 0.81 | 1.00 | 0.59 | 0.59 | -0.17 | -0.08 | -0.39 | 0.71 |
| P3 | 0.68 | 0.59 | 1.00 | 0.70 | -0.28 | -0.26 | -0.80 | 0.12 |
| P4 | 0.61 | 0.59 | 0.70 | 1.00 | -0.54 | -0.42 | -0.62 | -0.66 |
| P5 | -0.09 | -0.17 | -0.28 | -0.54 | 1.00 | 0.80 | 0.44 | 0.78 |
| P6 | -0.03 | -0.08 | -0.26 | -0.42 | 0.80 | 1.00 | 0.36 | 0.69 |
| P7 | -0.46 | -0.39 | -0.80 | -0.62 | 0.44 | 0.36 | 1.00 | 0.62 |
| P8 | 0.79 | 0.71 | 0.12 | -0.66 | 0.78 | 0.69 | 0.62 | 1.00 |
| if ↓ fires | P1 | P2 | P3 | P4 | P5 | P6 | P7 | P8 |
|---|---|---|---|---|---|---|---|---|
| P1 | 100 | 86 | 36 | 20 | 26 | 32 | 20 | 17 |
| P2 | 86 | 100 | 34 | 20 | 24 | 32 | 23 | 16 |
| P3 | 36 | 34 | 100 | 22 | 11 | 11 | 4 | 4 |
| P4 | 20 | 20 | 22 | 100 | 6 | 7 | 5 | 2 |
| P5 | 26 | 24 | 11 | 6 | 100 | 66 | 34 | 17 |
| P6 | 32 | 32 | 11 | 7 | 66 | 100 | 37 | 17 |
| P7 | 20 | 23 | 4 | 5 | 34 | 37 | 100 | 12 |
| P8 | 17 | 16 | 4 | 2 | 17 | 17 | 12 | 100 |
| Combo | Train n / mean / win | 2026 n / mean / win | 2026 mean of its single strategies | 2026 random mean (pctile) | p | BH q (11) | Jan–Sep 2026 | Oct 2026 | 2026 without best 3 trades | Counts? |
|---|---|---|---|---|---|---|---|---|---|---|
| K2_15 ≥2 strategies, same direction, within 15 min | 262 / -6.6 / 35% | 183 / -1.3 / 33% | +0.4 | -3.5 (70) | 0.621 | 0.69 | -3.7 | +29.7 | -5.0 | no |
| K3_30 ≥3 strategies, same direction, within 30 min | 160 / -11.0 / 31% | 111 / +1.3 / 36% | +0.4 | -2.4 (79) | 0.401 | 0.63 | -2.9 | +48.5 | -3.3 | no |
| K2_D ≥2 strategies, same direction, same day | 287 / -5.6 / 36% | 196 / -2.1 / 32% | +0.4 | -4.2 (74) | 0.694 | 0.69 | -4.3 | +24.6 | -5.5 | no |
| N2 NR7 day + P2 (contaminated) | 42 / +2.1 / 48% | 29 / +28.3 / 55% | -0.0 | -5.1 (100) | 0.025 | 0.13 | +23.8 | +155.7 | +9.7 | no |
| N3 NR7 day + P3 (contaminated) | 23 / +7.9 / 43% | 15 / +23.0 / 53% | +0.9 | -0.9 (97) | 0.097 | 0.21 | +13.5 | +155.7 | -4.6 | no |
| N4 NR7 day + P4 (contaminated) | 25 / +1.9 / 28% | 18 / +23.7 / 61% | +4.8 | -5.1 (99) | 0.047 | 0.13 | +16.3 | +149.4 | +2.2 | no |
| N234 NR7 day + ≥2 of P2/P3/P4 (contaminated) | 29 / +4.6 / 38% | 21 / +8.7 / 38% | +1.0 | -1.9 (86) | 0.258 | 0.47 | +1.4 | +155.7 | -12.1 | no |
| PAIR_BEST Best pair on train = P3+P4 | 34 / +0.7 / 38% | 25 / +19.8 / 56% | +2.5 | -0.8 (96) | 0.049 | 0.13 | +14.6 | +79.8 | +2.8 | no |
| PAIR_P1P5 ORB15 + Supertrend | 72 / -12.1 / 31% | 53 / +0.3 / 43% | -0.1 | -3.5 (72) | 0.482 | 0.66 | +0.4 | -2.9 | -7.3 | no |
| PAIR_P2P5 ORB5 + Supertrend | 66 / -8.3 / 36% | 50 / -3.0 / 40% | +1.8 | -3.1 (52) | 0.673 | 0.69 | -3.7 | +32.3 | -11.3 | no |
| PAIR_P3P4 PDH/PDL + narrow CPR | 34 / +0.7 / 38% | 25 / +19.8 / 56% | +2.5 | -0.8 (96) | 0.049 | 0.13 | +14.6 | +79.8 | +2.8 | no |
“Counts” needs q<0.10, a 2026 mean above its single strategies' 2026 mean, and ≥90th percentile vs random. PAIR_BEST turned out to be P3+P4, so it is the same test as PAIR_P3P4. BH over the 10 distinct tests gives the same answer (min q 0.16). Train pair ranking: all 28 pairs. Only P3+P4 was above 0 on train (+0.7, n=34). Every other pair lost.
Reading it. Requiring 2 or 3 strategies to agree lowered train expectancy compared with the single strategies (K3_30 −11.0 vs −5.9). By the time 3 signals agree, much of the move is already used up and the stop is wider. In 2026 the k-of-n combos were negative for Jan–Sep and positive only in October. P3+P4 (PDH/PDL breakout on a narrow-CPR day) is the only clean combo with a positive train and 2026 (+0.7 → +19.8, Jan–Sep 2026 +14.6, n=23). But it has 25 trades, q=0.13, a median train trade of −13, and depends on a few big days. It goes on the forward-watch list next to NR7.
| combo | 2024Q4 | 2025Q1 | 2025Q2 | 2025Q3 | 2025Q4 | 2026Q1 | 2026Q2 | 2026Q3 | 2026Q4 |
|---|---|---|---|---|---|---|---|---|---|
| K2_15 | -12.5 | -10.1 | -7.7 | -0.6 | -3.5 | 8.1 | -14.4 | -4.5 | 29.7 |
| K2_D | -12.2 | -7.0 | -5.8 | -1.7 | -2.9 | 5.6 | -13.0 | -5.3 | 24.6 |
| K3_30 | -22.9 | -11.0 | -15.0 | 2.1 | -13.3 | 1.5 | -11.1 | 1.8 | 48.5 |
| N2 | 0.7 | 10.2 | -1.0 | 1.6 | -1.2 | 60.3 | 2.8 | 17.0 | 155.7 |
| N234 | 30.4 | -7.7 | 34.4 | -24.6 | -7.9 | 19.0 | -25.0 | 4.3 | 155.7 |
| N3 | 22.1 | -17.1 | 35.6 | 8.6 | -21.6 | 39.1 | -13.6 | 2.1 | 155.7 |
| N4 | 59.5 | -11.4 | 35.8 | -26.5 | -9.2 | 34.4 | 2.8 | 4.1 | 149.4 |
| PAIR_BEST | -7.8 | -19.2 | 8.5 | 12.8 | -5.0 | 49.1 | 2.0 | -11.5 | 79.8 |
| PAIR_P1P5 | -23.2 | -13.1 | -28.6 | 1.8 | -4.6 | 1.2 | -7.9 | 10.7 | -2.9 |
| PAIR_P2P5 | -19.3 | -10.5 | -26.5 | 9.8 | -4.3 | -11.3 | -11.2 | 9.3 | 32.3 |
| PAIR_P3P4 | -7.8 | -19.2 | 8.5 | 12.8 | -5.0 | 49.1 | 2.0 | -11.5 | 79.8 |
| combo | 2022 | 2023 | 2024 | 2025 | 2026 |
|---|---|---|---|---|---|
| K2_15 | -0.2 | -6.2 | 7.3 | -4.1 | 4.0 |
| K2_D | 4.2 | -5.8 | 5.1 | -1.5 | 2.0 |
| K3_30 | -2.4 | -13.2 | 5.8 | -10.2 | 9.6 |
| N2 | 14.7 | -1.7 | -18.0 | 10.5 | 62.7 |
| N234 | -29.2 | 9.6 | 11.6 | 0.4 | 22.4 |
| N3 | -12.6 | 5.5 | 20.2 | 8.2 | 46.2 |
| N4 | – | – | 96.8 | -7.2 | 58.8 |
| PAIR_BEST | – | – | 27.6 | 11.2 | 48.0 |
| PAIR_P1P5 | – | – | -12.7 | -9.8 | 12.9 |
| PAIR_P2P5 | – | – | -10.8 | -3.6 | 7.0 |
| PAIR_P3P4 | – | – | 27.6 | 11.2 | 48.0 |
On spot, k-of-n agreement flips sign from year to year (K2_15: −0.2, −6.2, +7.3, −4.1, +4.0). P3+P4 needs VWAP for P4, so it only starts Oct-2024.
Added after Satya's 21:24 IST question: “what about option premium support strategy”. Pre-registered at 21:26 IST in PREREG.md before any result. Real 1m ATM weekly option bars 21-Oct-2024 to 23-Oct-2026. The chart is the current ATM strike's own 5m premium chart. Costs ≈0.5 pt per side plus statutory charges (STT 0.15% of sell premium from 1-Apr-2026). Train Oct-2024–Dec-2025, test 2026. Random benchmark = same minute, same CE/PE, ATM on random days of the same split, same exit.
| Study (nifty-setups-backtest) | What it was | Out-of-sample result |
|---|---|---|
| atm-daily-sr | Prior-day ATM CE/PE premiums mapped to spot S/R rails (half-scale), bounce/retest entries; index book SL20, 40%@+20, 30%@+40, trail rest | 275 trades, −10.3 pts per trade net (−0.3 gross); old futures-style costs ~10 pts per trade |
| atm-daily-sr-optbuyer | Same levels, booked as option buyer (SL10, 40%@+10, 30%@+20, trail) | 476 trades, −1.5 option pts per trade net, −0.5 gross, 47% win |
| confluence-v1 | Retailer trap + AMD fake-break + ATM premium black-box support bounce, all same direction | 20 trades, +7.2 gross but −4.2 net (cost ~11 pts per trade), p=0.48 |
| confluence-v1-scaleout | Same entry, SL20 / 40%@+20 / 30%@+40 / trail exit | 30 trades, −0.4 gross, −12.2 net |
| trader-filters-r126 | Black box or round-50 + rejection wick (R1), plus R2/R6 filters, option buyer | All 8 parameter sets net negative (≈ −1.5 to −2 pts per trade, n≈1,000–2,000) |
| trader log (hand-logged stream calls) | 11 “Black Box” trades May–Jul 2026 | 10 of 11 marked WIN. These are discretionary, hand-logged calls with no fixed rule and no losers' log, so they cannot be reproduced or tested. |
The confluence idea was the only one with a positive gross result, and that was on 20 trades. Under corrected costs (~2 pts per round trip instead of ~11), +7.2 gross would still be only about +5 net on n=20, which is not testable evidence.
| Variant | Exit | Train n / mean / win | 2026 n / mean / win | 2026 mean before charges | 2026 random mean (pctile) | p | BH q (8) | Jan–Sep 2026 | Oct 2026 | 2026 without best 3 | Counts? |
|---|---|---|---|---|---|---|---|---|---|---|---|
| V1 Prior-day premium low bounce | old: SL20, 40%@+20, 30%@+40, trail rest | 74 / -3.5 / 49% | 35 / -10.4 / 26% | -9.2 | -3.4 (2) | 1.00 | 1.00 | -11.1 | -4.8 (n=4) | -14.2 | no |
| V1 Prior-day premium low bounce | structural stop, trail 50% after 2R | 74 / -8.8 / 24% | 35 / -15.1 / 14% | -14.1 | -0.4 (0) | 1.00 | 1.00 | -13.6 | -26.9 (n=4) | -18.7 | no |
| V2 Intraday premium swing-low bounce ("black box") | old: SL20, 40%@+20, 30%@+40, trail rest | 254 / -2.2 / 45% | 175 / -4.0 / 43% | -2.7 | -2.8 (20) | 0.99 | 1.00 | -4.0 | -4.0 (n=13) | -4.7 | no |
| V2 Intraday premium swing-low bounce ("black box") | structural stop, trail 50% after 2R | 254 / -3.3 / 29% | 175 / -2.8 / 29% | -1.8 | -0.9 (21) | 0.91 | 1.00 | -3.0 | -0.5 (n=13) | -5.2 | no |
| V3 Round premium level (×25) bounce | old: SL20, 40%@+20, 30%@+40, trail rest | 271 / -1.7 / 47% | 189 / -4.3 / 43% | -3.0 | -3.2 (21) | 1.00 | 1.00 | -4.6 | -1.0 (n=15) | -5.0 | no |
| V3 Round premium level (×25) bounce | structural stop, trail 50% after 2R | 271 / -2.8 / 30% | 189 / -7.0 / 24% | -6.0 | -1.4 (1) | 1.00 | 1.00 | -8.3 | +7.4 (n=15) | -9.6 | no |
| V4 Premium day-high breakout (resistance break) | old: SL20, 40%@+20, 30%@+40, trail rest | 223 / -2.2 / 47% | 156 / -4.8 / 42% | -3.5 | -3.4 (21) | 1.00 | 1.00 | -5.2 | -0.7 (n=15) | -5.5 | no |
| V4 Premium day-high breakout (resistance break) | structural stop, trail 50% after 2R | 223 / -3.8 / 31% | 156 / -1.8 / 28% | -0.7 | -3.0 (71) | 0.73 | 1.00 | -1.0 | -8.6 (n=15) | -5.3 | no |
V1 level = prior-day low of the same contract. V2 = most recent confirmed 5m swing low after 09:30. V3 = multiple of 25 (premium 40–400). V1–V3 need a touch within max(2 pts, 3%) approached from above, then the next 5m close above the touch-bar high. V4 = 5m close above the premium's high of the day so far. Entry is at the next 1m option open. First event per day. “Counts” needs q<0.10, ≥90th percentile vs random, and still positive without the best 3 trades. Pre-charge means include the 0.5 pt per side slippage.
Reading it. Every variant and both exits lost money in both periods, and no BH q is below 1.00. Several are worse than random entries at the same minute (V1, and V3 with the trail exit, sit at the 0–2nd percentile). A premium bouncing off its support does not predict the next move any better than chance. The prior-day premium low is the worst level, probably because overnight theta decay pulls the premium down to it mechanically rather than real buyers defending it. Satya's old scale-out exit and the trail-50% exit give the same answer. October 2026 does not rescue it either (Oct 2026: V3 trail +7.4 on 15 trades; the others are negative).
| var | ex | label | buckets | train_n | train_mean | test_n | test_mean | always_on_test | random_same_bucket_mean | subset_pctile | t_p | q_bh | counts |
|---|---|---|---|---|---|---|---|---|---|---|---|---|---|
| V1 | X_OLD | none | – | 0 | – | 0 | – | -10.37 | – | – | 1.00 | 1.00 | no |
| V1 | X_T50 | none | – | 0 | – | 0 | – | -15.13 | – | – | 1.00 | 1.00 | no |
| V2 | X_OLD | L1_VIX | >16 | 43 | 2.87 | 52 | -8.97 | -4.00 | -3.33 | 1.55 | 1.00 | 1.00 | no |
| V2 | X_T50 | L3_ER20 | mid0.2-0.4 | 80 | 1.82 | 44 | -6.92 | -2.84 | -1.18 | 14.15 | 0.97 | 1.00 | no |
| V3 | X_OLD | L5_NR7 | NR7 | 40 | 6.72 | 27 | -7.19 | -4.33 | -4.40 | 20.55 | 0.97 | 1.00 | no |
| V3 | X_T50 | L4_PDR | normal | 98 | 0.74 | 67 | -4.81 | -7.04 | 1.07 | 77.30 | 0.87 | 1.00 | no |
| V4 | X_OLD | L2_DMA_trend | up | 94 | 1.23 | 41 | -5.53 | -4.75 | -4.14 | 40.20 | 0.95 | 1.00 | no |
| V4 | X_T50 | L2_DMA_trend | mixed | 46 | 0.01 | 33 | -2.73 | -1.76 | -2.47 | 45.95 | 0.69 | 1.00 | no |
The train-chosen regime (VIX>16, NR7, uptrend, …) lost money in 2026 in all 6 cases where a filter qualified, and was worse than always-on in 5 of those 6 (V1 had no qualifying filter). 0 of 8 count.
| var | 2024Q4 | 2025Q1 | 2025Q2 | 2025Q3 | 2025Q4 | 2026Q1 | 2026Q2 | 2026Q3 | 2026Q4 |
|---|---|---|---|---|---|---|---|---|---|
| V1 | -24.3 | -7.3 | -12.1 | -0.7 | -2.3 | -23.4 | -15.6 | -4.4 | -26.9 |
| V2 | -6.2 | 2.7 | -4.9 | -3.5 | -5.1 | -4.2 | -0.0 | -4.6 | -0.5 |
| V3 | -2.4 | -6.2 | -0.0 | -6.5 | 1.3 | -6.9 | -10.3 | -7.6 | 7.4 |
| V4 | -8.6 | 1.2 | -7.1 | -4.4 | -1.5 | 3.5 | -3.0 | -3.3 | -8.6 |
| var | 2024Q4 | 2025Q1 | 2025Q2 | 2025Q3 | 2025Q4 | 2026Q1 | 2026Q2 | 2026Q3 | 2026Q4 |
|---|---|---|---|---|---|---|---|---|---|
| V1 | -1.6 | -1.9 | -3.6 | -6.3 | -3.8 | -17.3 | -11.7 | -5.9 | -4.8 |
| V2 | -4.0 | 1.0 | -1.5 | -6.6 | -0.4 | -4.9 | -7.3 | -0.1 | -4.0 |
| V3 | -4.9 | -0.6 | -1.3 | -6.8 | 3.7 | -1.7 | -6.2 | -5.8 | -1.0 |
| V4 | -7.2 | 1.2 | -3.5 | -4.1 | 1.3 | -5.7 | -4.0 | -5.8 | -0.7 |
Monthly and regime-bucket tables: prem_by_period.csv · prem_regime_buckets.csv · trades prem_trades.csv.
Added after Satya's 21:34 IST question: “why can't you find those discretion rules”. Design pre-registered at 21:37 IST in PREREG.md (TRADER-DISCRETION) before any taken/skipped or outcome number was seen. Real 1m Nifty ATM weekly option bars. Corrected costs (≈0.5 pt per side plus statutory charges, STT 0.15% of sell premium from 1-Apr-2026).
The log is trader-log/trades_timestamped.csv: 225 rows, 06-May to 05-Oct-2026, built from stream screenshots and the fixed-date Excel files with entry premium and start/stop times. 218 rows are usable (one NO_TRADE row and rows with no time or strike removed): 110 Nifty and 108 Sensex. Sensex rows are mapped to the Nifty ATM equivalent at the same minute. Logged result: 169 WIN, 47 LOSS, 2 BE (78% wins).
How well the log matches real option bars (earlier fill-match work): only 22 of 218 (10%) match the real premium at the logged time (tiers A/B/B2/C: exact, within ±5 or ±15 minutes, or within 5% of the premium). 148 (68%) match only on strike and time, because the log has no usable premium. 47 (22%) disagree with the real bars (wrong premium, or the strike did not trade). When the earlier loose premium matcher was tried at shifted placebo times, it matched about as often as at the logged times (Nifty 29% vs 31% placebo). So the logged premiums do not reliably identify a real fill.
| family | entries | log_win_pct | replay_win_pct | xold_nifty_atm_pts | covered_by_any_rule_pct | covered_by_V_pct |
|---|---|---|---|---|---|---|
| BREAK | 57 | 82 | 25 | -1 | 33 | 21 |
| CONT | 41 | 56 | 40 | 1 | 29 | 17 |
| SUPPORT | 40 | 65 | 23 | -1 | 35 | 25 |
| PM3 | 24 | 88 | 45 | 1 | 8 | 8 |
| SWEEP | 17 | 88 | 18 | -6 | 41 | 24 |
| BLACKBOX | 15 | 93 | 7 | -6 | 33 | 33 |
| OTHER | 12 | 92 | 20 | -2 | 25 | 8 |
| BTST | 9 | 100 | 12 | -12 | 22 | 0 |
| NEWS | 3 | 100 | 33 | 6 | 67 | 33 |
Replay win = the earlier fill-match simulation with the logged stop and target on real 1m bars. X_OLD = Nifty ATM option bought at the next 1m open after the logged time, with the SL20 / 40%@+20 / 30%@+40 / trail exit. Covered = an entry of ours (V1–V4 premium-support or P1–P8) fired the same day, same direction, within ±10 minutes.
What this shows. On real bars the trader's calls are ordinary. The overall replay win rate is 27% versus 78% logged, and the Black Box calls go from 14 of 15 logged wins to 1 of 15 in the replay. Some of the gap is how the replay works: it uses the Nifty ATM and the next 1m open, while he may have used a different strike, a better fill or a manual exit. That gap can't be closed, because 68% of rows have no premium to check against. But a 78% → 27% drop is far too big to be explained by fills alone.
Across the 53 days with log entries our rules made 662 candidate entries; 103 (15.6%) line up with one of his entries. Only 30% of his entries are matched by any rule of ours, and 19% by a premium-support rule. Placebo check: shift his entry times by ±30 or ±60 minutes and the match rate is 8.8–13.1%, or 11% if the direction is flipped. So his entries line up with our setups only slightly more often than chance. Most of what he does is not one of these setups.
| src | candidates | taken | take_rate_pct | xold_mean | xt50_mean |
|---|---|---|---|---|---|
| P1 | 47 | 8 | 17.0 | -9.4 | -10.4 |
| P2 | 49 | 14 | 28.6 | -5.5 | -9.3 |
| P3 | 14 | 5 | 35.7 | -5.0 | -12.5 |
| P4 | 10 | 3 | 30.0 | -8.1 | -24.4 |
| P5 | 41 | 7 | 17.1 | -2.4 | 1.5 |
| P6 | 48 | 7 | 14.6 | -0.7 | -4.3 |
| P7 | 42 | 2 | 4.8 | 0.7 | 8.9 |
| P8 | 15 | 4 | 26.7 | 0.4 | 9.4 |
| V1 | 14 | 5 | 35.7 | -0.4 | -9.0 |
| V2 | 124 | 21 | 16.9 | -5.0 | 0.8 |
| V3 | 170 | 18 | 10.6 | -5.6 | -4.4 |
| V4 | 88 | 9 | 10.2 | -5.9 | -6.4 |
| taken | n | xold_mean | xold_win_pct | xt50_mean | xt50_win_pct |
|---|---|---|---|---|---|
| skipped | 559 | -5.06 | 42 | -3.05 | 28 |
| taken | 103 | -2.12 | 46 | -6.04 | 29 |
The taken candidates did no better than the skipped ones. They were better with the old exit (−2.1 vs −5.1) and worse with the trail-50% exit (−6.0 vs −3.0). Both groups lose money. Skipping those candidates did not avoid losers.
| feature | taken_mean | skipped_mean | smd | mw_p | n_taken | n_skipped | q_bh |
|---|---|---|---|---|---|---|---|
| tod | 100.796 | 137.596 | -0.407 | 0.000 | 103 | 559 | 0.001 |
| oi_chg15 | 13.190 | 6.956 | 0.299 | 0.001 | 93 | 546 | 0.012 |
| prior_trades | 2.282 | 1.832 | 0.286 | 0.004 | 103 | 559 | 0.022 |
| vix | 15.373 | 14.907 | 0.185 | 0.082 | 103 | 559 | 0.348 |
| basis_chg15 | 1.698 | 1.325 | 0.010 | 0.228 | 93 | 546 | 0.589 |
| prem_chg5 | 8.092 | 7.828 | 0.034 | 0.257 | 103 | 559 | 0.589 |
| dist_round50 | 12.275 | 13.162 | -0.120 | 0.258 | 103 | 559 | 0.589 |
| pcr_chg15 | -0.005 | -0.012 | 0.032 | 0.304 | 93 | 546 | 0.589 |
| prem_dd | 13.202 | 15.073 | -0.137 | 0.312 | 103 | 559 | 0.589 |
| dist_round100 | 26.583 | 25.282 | 0.092 | 0.397 | 103 | 559 | 0.675 |
| basis | 48.162 | 48.878 | -0.016 | 0.469 | 103 | 559 | 0.725 |
| spot_mv15 | 27.906 | 25.207 | 0.098 | 0.548 | 93 | 546 | 0.748 |
| gap | -0.104 | -0.140 | 0.070 | 0.572 | 103 | 559 | 0.748 |
| spot_pos | 0.733 | 0.721 | 0.044 | 0.726 | 103 | 559 | 0.881 |
| expiry_day | 0.184 | 0.193 | -0.022 | 0.837 | 103 | 559 | 0.903 |
| prem_chg15 | 11.045 | 10.637 | 0.029 | 0.850 | 93 | 546 | 0.903 |
| dte | 4.699 | 4.628 | 0.034 | 0.919 | 103 | 559 | 0.919 |
Only three features differ after BH. Time of day: taken entries come ~37 minutes earlier on average (SMD −0.41). Prior trades that day: more trades already that day (+0.29). ATM OI change over 15 minutes: OI rising faster (+0.30). Premium drawdown, speed of fall, bounce speed, distance from the day high/low and from round levels, gap, basis, PCR change and expiry day show no difference (|SMD| ≤ 0.14). “Prior trades” is a property of his day, not of the market, so it cannot become a rule.
| Model | Leave-one-day-out AUC (May–Jul) | Holdout AUC (Aug–Oct) |
|---|---|---|
| Depth-2 tree (min leaf 10) | 0.49 | 0.46 |
| L2 logistic, 17 features | 0.61 | 0.55 |
An AUC of 0.5 means the model does no better than a coin flip at telling taken from skipped. The logistic's 0.61 in CV comes almost entirely from time of day and prior trades (coefficients −1.2 and +0.8). It drops to 0.55 on the held-out months. This repeats the early-Oct remine (trader-filter-mine-timed), where the holdout AUC was ≈0.5 and the best broad rule (near the day extreme and a calm 3-minute move) had lift 1.24 with a CI of 0.84–1.61.
Extraction rule (fixed in advance): take the tree leaf with the highest take rate among leaves with ≥10 takes, provided it is at least 1.2× the base rate. Result: tod <= 36.50 AND basis_chg15 > -8.25. tod is minutes after 09:15, so 36.5 means before about 09:52 IST. On May–Jul this leaf took 34 of 65 candidates (52%) against a base rate of 16%.
Held-out log months (Aug–Oct 2026): the filter fired 17 times and he took 1. Lift 0.41 (base 14%), day-block bootstrap 90% CI 0.00–1.35. Failed: the CI needed to be above 1.
As a strategy on 2024–26 history (May–Jul 2026 excluded; first filtered candidate per day; random = same candidate minute and type on random days, 30 repeats; BH over 4):
| period | exit | n | mean | win | total | p | rand_mean | rand_pctile | drop_top3 | q_bh | counted |
|---|---|---|---|---|---|---|---|---|---|---|---|
| Oct24-Dec25 | xold | 229 | -2.91 | 46.29 | -665.79 | 0.98 | -2.53 | 53.33 | -3.42 | 0.98 | False |
| Oct24-Dec25 | xt50 | 229 | -3.76 | 32.75 | -861.98 | 0.91 | -3.72 | 56.67 | -6.32 | 0.98 | False |
| 2026 (Jan-Apr+Aug-Oct) | xold | 104 | -2.30 | 48.08 | -238.74 | 0.87 | -2.26 | 46.67 | -3.42 | 0.98 | False |
| 2026 (Jan-Apr+Aug-Oct) | xt50 | 104 | 4.54 | 36.54 | 472.48 | 0.21 | -4.07 | 96.67 | -1.58 | 0.82 | False |
0 of 4 count. Three of the four are negative and no better than random. The 2026 trail-50% row is +4.5 per trade at the 97th percentile vs random, but q=0.82 and −1.6 without its best 3 trades, the same October-heavy pattern as the rest of this page.
Files: disc_trader_entries.csv · disc_candidates.csv · disc_feature_contrast.csv · disc_model.json · disc_filter_fullhist.csv. Scripts: s9_discretion.py, s9b_fullhist.py, s10_disc_model.py (sklearn), s11_disc_fullhist.py.
Added after Satya's 23:15 IST (26-Oct) request. Source: the trader's public live streams at youtube.com/@KarolSEBIRegisteredIITian/streams. We read stream metadata and Hindi auto-captions with yt-dlp, with no login, cookies or credentials. 360p two-second clips were used only to read the strike label on screen, then deleted. No video is embedded or redistributed; the links below go to the original streams. Design pre-registered at 23:40 IST in PREREG.md (YOUTUBE-CALLS), before any call was scored. Research only, not advice.
105 past live streams, 2026-05-06T08:57 to 2026-10-23T09:03 IST (554 hours). All have Hindi auto-captions. Over the 118 trading days from 06-May to 23-Oct-2026: 74 days have full market-hours coverage, 24 partial (<80% of 09:15–15:30), and 20 have no stream (06-30, 07-06, 07-15, 07-17, 07-20, 07-21, 07-22, 07-23, 07-24, 08-13, 08-24, 09-02, 09-04, 09-18, 09-22, 09-24, 09-25, 09-28, 09-30, 10-12). Some may have been deleted or never streamed; we cannot tell which. Files: yt_stream_inventory.csv · yt_trading_day_coverage.csv.
289 caption-rule candidates → 110 dropped as promo/gold/crypto talk → 179 reviewed → 58 fresh calls. The other 121 were retrospective, commentary, vague, or conditional plans with no activation. Of the 58: 29 scored, 13 not scorable (Sensex after 05-Oct, no real bars), 9 strike unreadable, 7 side not stated. That is about 1.9 extractable calls per session, against the ~10 per day in his self-reported log.
| Stream time (IST, links to the original stream at that second) | Contract | SL / target pts (*=fallback) | Entry bar @ price | Exit | Net pts | His stated outcome | Setup |
|---|---|---|---|---|---|---|---|
| 2026-08-25 09:23 | NIFTY 24300 PE | 5.5 / 10 | 09:24 @ 115.3 | T 09:25 | +8.5 | SL | SCALP |
| 2026-08-27 09:31 | SENSEX 77700 PE | 20* / 50 | 09:32 @ 332.8 | SL 09:32 | -23.6 | T | OTHER |
| 2026-08-28 09:17 | SENSEX 77000 CE | 22 / 30 | 09:18 @ 634.2 | SL 09:19 | -26.3 | T | OTHER |
| 2026-08-28 09:43 | SENSEX 77000 CE | 20* / 30 | 09:44 @ 734.1 | SL 09:47 | -24.6 | SL | OTHER |
| 2026-09-03 12:03 | SENSEX 77100 PE | 20* / 50 | 12:04 @ 437.7 | SL 12:05 | -23.9 | no_claim | OTHER |
| 2026-09-03 12:57 | SENSEX 76400 CE | 20* / 37 | 12:58 @ 330.2 | SL 12:58 | -23.6 | T | BREAK/TRENDLINE |
| 2026-09-03 15:01 | SENSEX 76400 CE | 13.5 / 20 | 15:02 @ 253.8 | SL 15:02 | -16.9 | no_claim | OTHER |
| 2026-09-07 11:13 | NIFTY 24100 PE | 2.5 / 10 | 11:14 @ 303.5 | SL 11:14 | -4.4 | no_claim | OTHER |
| 2026-09-10 11:12 | SENSEX 74500 CE | 20* / 40* | 11:13 @ 350.6 | T 11:15 | +36.2 | T | SUPPORT/REJECTION |
| 2026-09-10 11:19 | SENSEX 75000 PE | 20* / 40* | 11:20 @ 283.1 | T 11:42 | +36.4 | T | SUPPORT/REJECTION |
| 2026-09-11 10:16 | NIFTY 23150 CE | 12* / 10 | 10:17 @ 194.2 | T 10:21 | +8.3 | T | SCALP |
| 2026-09-15 10:29 | NIFTY 23700 PE | 12* / 24* | 10:30 @ 332.1 | T 10:46 | +21.9 | no_claim | OTHER |
| 2026-09-15 14:09 | NIFTY 23400 PE | 12* / 101 | 14:10 @ 149.4 | time 15:15 | +58.8 | no_claim | SCALP |
| 2026-09-17 10:11 | SENSEX 74000 CE | 20* / 25 | 10:12 @ 614.8 | SL 10:13 | -24.3 | T | BREAK/TRENDLINE |
| 2026-09-17 11:45 | SENSEX 74000 CE | 20 / 40* | 11:46 @ 438.9 | SL 11:46 | -23.9 | SL | OTHER |
| 2026-09-17 14:28 | SENSEX 74000 CE | 20* / 40* | 14:29 @ 422.1 | T 14:30 | +36.1 | T | BREAK/TRENDLINE |
| 2026-09-23 09:18 | SENSEX 74300 CE | 20* / 40* | 09:19 @ 546.9 | T 09:19 | +35.8 | T | OTHER |
| 2026-09-23 09:25 | SENSEX 74300 CE | 18 / 36* | 09:26 @ 532.9 | SL 09:26 | -22.1 | no_claim | SCALP |
| 2026-09-23 09:54 | SENSEX 74800 PE | 20* / 21 | 09:55 @ 327.9 | SL 09:56 | -23.6 | no_claim | OTHER |
| 2026-09-29 10:26 | NIFTY 22500 CE | 4 / 15 | 10:27 @ 132.1 | SL 10:28 | -5.5 | no_claim | SCALP |
| 2026-10-01 10:01 | SENSEX 72000 CE | 20* / 40* | 10:02 @ 559.6 | SL 10:03 | -24.1 | no_claim | BREAK/TRENDLINE |
| 2026-10-01 12:46 | SENSEX 72300 PE | 60 / 120* | 12:47 @ 436.0 | T 12:50 | +115.9 | no_claim | BREAK/TRENDLINE |
| 2026-10-01 15:11 | SENSEX 71600 CE | 20 / 50 | 15:12 @ 364.4 | SL 15:12 | -23.7 | T | OTHER |
| 2026-10-05 10:26 | NIFTY 22400 CE | 12* / 15 | 10:27 @ 169.8 | T 10:28 | +13.3 | no_claim | SCALP |
| 2026-10-05 12:06 | NIFTY 22650 PE | 12* / 24* | 12:07 @ 232.5 | SL 12:18 | -13.8 | no_claim | OTHER |
| 2026-10-05 12:54 | NIFTY 22650 PE | 12* / 36 | 12:55 @ 214.5 | SL 12:57 | -13.7 | T | OTHER |
| 2026-10-05 14:09 | NIFTY 22400 CE | 15 / 30 | 14:10 @ 182.5 | T 14:21 | +28.3 | T | BREAK/TRENDLINE |
| 2026-10-09 12:17 | NIFTY 22200 CE | 12* / 24* | 12:18 @ 321.7 | T 12:49 | +22.0 | no_claim | OTHER |
| 2026-10-16 09:18 | NIFTY 23150 PE | 12* / 20 | 09:19 @ 258.6 | SL 09:20 | -13.8 | no_claim | BREAK/TRENDLINE |
Entry = open of the next 1m bar after the call minute, +0.5 slippage. SL/target are from his spoken points (fallback SL 12 Nifty / 20 Sensex, target 2×SL, marked *). Same-bar SL+target counts as SL. Time exit 15:15. −0.5 slippage at exit plus Rs20/order, STT 0.15%, exchange, SEBI, stamp and GST (Nifty lot 65, Sensex 20). Nifty and Sensex points are different sizes (Sensex premiums are roughly 3× Nifty), so the pooled mean is only indicative. Before charges: +5.6 per trade. With target forced to 2×SL: +2.7.
| group | n | win | pts | total | cut |
|---|---|---|---|---|---|
| BREAK/TRENDLINE | 7.0 | 42.9 | 13.5 | 94.4 | setup |
| OTHER | 14.0 | 21.4 | -9.9 | -138.6 | setup |
| SCALP | 6.0 | 66.7 | 10.2 | 61.3 | setup |
| SUPPORT/REJECTION | 2.0 | 100.0 | 36.3 | 72.6 | setup |
| NIFTY | 12.0 | 58.3 | 9.2 | 109.9 | index |
| SENSEX | 17.0 | 29.4 | -1.2 | -20.1 | index |
| SL | 3.0 | 33.3 | -13.3 | -39.9 | stated outcome |
| T | 12.0 | 50.0 | 3.8 | 45.9 | stated outcome |
| no_claim | 14.0 | 35.7 | 6.0 | 83.8 | stated outcome |
His stated outcomes are the first “target done/touched” or “SL hit” phrase within 40 minutes of the call. They agree with real bars on 53% of the 15 scored calls where he stated one. A stated “target done” was a real target hit 6 of 12 times. By stated outcome: “target” calls +3.8 per trade (n=12), “SL” calls -13.3 (n=3), no claim +6.0 (n=14).
| date | log_rows | log_wins | log_pts | matched_yt_10min | stream_that_day | yt_fresh_calls |
|---|---|---|---|---|---|---|
| 2026-08-26 | 4 | 3 | 199 | 1 | yes | 1 |
| 2026-08-31 | 2 | 2 | 115 | 0 | yes | 0 |
| 2026-09-01 | 13 | 10 | 304 | 0 | yes | 0 |
| 2026-09-11 | 7 | 6 | 459 | 0 | yes | 1 |
| 2026-09-25 | 5 | 4 | 620 | 0 | no stream | 0 |
| 2026-10-05 | 3 | 2 | 71 | 0 | yes | 4 |
The log covers only 6 dates in this window. On 25-Sep there was no stream, yet the log shows 5 trades for +620 pts. On 05-Oct the log's strikes (Nifty 24800CE, Sensex 79500) are 2,200 Nifty and 7,300 Sensex points away from that day's market (spot ≈22,580 / ≈72,200). On 01-Sep the log has 13 trades (10 wins), but the stream that day gives no fresh call with an activation. Overall, 1 of 34 log rows match a stream call (same side, ±10 min). The self-reported log is not a record of the live calls.
Same method as the Trader discretion section (s9/s10 code unchanged; YouTube calls with known side as “taken”; fit 25-Aug..30-Sep, holdout 1–23-Oct). 51 calls with a known side → 50 with entry-time features; 315 candidates; fit base take rate 12%. 48% of his calls have one of our V1–V4/P1–P8 candidates within ±10 min, same direction. The strongest contrasts: he takes trades after a strong move in his direction (side-aligned spot move over 15 min, standardised difference ≈1.0; 15-min premium change 19.5 vs 9.5 for skipped; BH q<0.01). In plain words, he chases momentum.
| feature | taken_mean | skipped_mean | smd | mw_p | q_bh |
|---|---|---|---|---|---|
| spot_mv15 | 44.850 | 19.613 | 1.019 | 0.000 | 0.000 |
| prem_chg15 | 19.458 | 9.456 | 0.823 | 0.000 | 0.000 |
| prem_chg5 | 12.511 | 8.153 | 0.618 | 0.000 | 0.001 |
| spot_pos | 0.865 | 0.692 | 0.555 | 0.002 | 0.007 |
| gap | -0.243 | -0.046 | -0.534 | 0.002 | 0.007 |
| prem_dd | 8.716 | 16.103 | -0.486 | 0.002 | 0.007 |
Tree CV AUC 0.57 / holdout 0.62; logistic 0.54 / 0.47. No tree leaf had ≥10 takes at ≥1.2× the base rate, so the pre-registered extraction gives no filter. There is nothing to test on held-out data or 2024–26 history, and we did not go looking for one after the fact. Candidates he took: X_OLD −0.8 pts per trade (n=46). Skipped: −4.2 (n=269). Both are ≤0.
Files: yt_calls_scored.csv · yt_review_adjudicated.csv · yt_random_bench.csv · yt_by_group.csv · yt_vs_selflog.csv · yt_disc_candidates.csv · yt_disc_model.json · scripts scripts/yt_*.py, s12_yt_discretion.py, s13_yt_disc_model.py.
Added after Satya's 19:55 IST (27-Oct) question: “on expiries opposite to trend from around 20 premium there is 2x or 3x jumps”. Design pre-registered at 20:05 IST in PREREG.md (EXPIRY-CHEAP-COUNTER) before any number was computed. Real 1m bars of the expiring contract:
Spot 15:15–15:29 is treated as missing. Settlement uses the official close. Option buyer only.
| ix | signal set | expiry_days | signals | reached 2× % | reached 3× % | reached 5× % | median min to peak | settled ≈0 % |
|---|---|---|---|---|---|---|---|---|
| NIFTY | counter 15–25 | 108 | 170.0 | 40.0 | 21.2 | 11.8 | 32.5 | 82.9 |
| NIFTY | with-trend 15–25 | 108 | 170.0 | 42.9 | 21.2 | 10.6 | 26.0 | 79.4 |
| NIFTY | counter 10–30 | 108 | 171.0 | 39.8 | 21.6 | 11.7 | 30.0 | 83.0 |
| NIFTY | counter DECAY 15–25 | 108 | 156.0 | 39.7 | 19.2 | 7.7 | 52.5 | 78.8 |
| NIFTY | counter W1 09:35–11 | 108 | 149.0 | 41.6 | 22.8 | 12.8 | 36.0 | 82.6 |
| NIFTY | counter W2 11–13 | 108 | 133.0 | 38.3 | 21.8 | 10.5 | 46.0 | 75.9 |
| NIFTY | counter W3 13–14:30 | 108 | 114.0 | 45.6 | 21.1 | 7.9 | 34.0 | 71.9 |
| NIFTY | counter W4 14:30–15 | 108 | 56.0 | 30.4 | 16.1 | 5.4 | 8.0 | 71.4 |
| NIFTY | random minute 15–25 (30 reps) | 108 | 5,093.0 | 35.0 | 20.9 | 9.2 | 27.0 | 79.4 |
| SENSEX | counter 15–25 | 104 | 166.0 | 38.0 | 18.7 | 7.2 | 28.0 | 95.2 |
| SENSEX | with-trend 15–25 | 104 | 167.0 | 35.9 | 21.0 | 13.2 | 20.0 | 93.4 |
| SENSEX | counter 10–30 | 104 | 167.0 | 37.7 | 18.6 | 7.2 | 28.0 | 95.2 |
| SENSEX | counter DECAY 15–25 | 104 | 157.0 | 32.5 | 19.1 | 8.9 | 26.0 | 96.2 |
| SENSEX | counter scaled band | 104 | 167.0 | 43.7 | 25.1 | 11.4 | 42.0 | 80.2 |
| SENSEX | counter W1 09:35–11 | 104 | 151.0 | 39.1 | 19.2 | 7.3 | 28.0 | 94.7 |
| SENSEX | counter W2 11–13 | 104 | 138.0 | 32.6 | 21.0 | 13.0 | 32.0 | 96.4 |
| SENSEX | counter W3 13–14:30 | 104 | 131.0 | 31.3 | 21.4 | 12.2 | 15.0 | 90.8 |
| SENSEX | counter W4 14:30–15 | 104 | 103.0 | 36.9 | 25.2 | 10.7 | 9.0 | 87.4 |
| SENSEX | random minute 15–25 (30 reps) | 104 | 4,980.0 | 32.2 | 18.9 | 9.0 | 17.0 | 94.4 |
“Reached N×” = a later 1m high ≥ N × the signal-minute close, at any time up to 15:29. Measured from the fill (next open +slippage), ≥2× drops slightly. The median signal minute is 09:36, because a 15–25 option on the counter side usually already exists right after the trend check starts. Sensex points are about 3.3× Nifty points, so a raw 15–25 Sensex option is much further OTM; the “scaled band” row fixes that.
Share of expiry days where a counter-trend first signal (either side) reached 2× / 3× / 5×, by year:
| ix | year | days_with_signal | any2x | any3x | any5x |
|---|---|---|---|---|---|
| NIFTY | 2024 | 12 | 41.7 | 25.0 | 25.0 |
| NIFTY | 2025 | 53 | 45.3 | 28.3 | 18.9 |
| NIFTY | 2026 | 43 | 55.8 | 32.6 | 16.3 |
| SENSEX | 2024 | 12 | 50.0 | 33.3 | 8.3 |
| SENSEX | 2025 | 52 | 40.4 | 25.0 | 7.7 |
| SENSEX | 2026 | 40 | 60.0 | 32.5 | 17.5 |
Quarterly: ec_freq_quarter.csv.
| ix | exit | split | n | mean net pts | median | win % | p10 | p90 | best | mean w/o top 3 | with-trend control | random-minute mean | pctile vs random | p | BH q (6) | counts |
|---|---|---|---|---|---|---|---|---|---|---|---|---|---|---|---|---|
| NIFTY | half 2x / half 3x or close | train | 99 | -7.37 | -18.75 | 23.23 | -23.66 | 27.90 | 35.93 | -8.70 | -6.79 | -8.39 | 83.33 | 0.00 | – | False |
| NIFTY | half 2x / half 3x or close | test | 70 | -6.08 | -18.17 | 24.29 | -23.89 | 30.14 | 36.58 | -7.90 | -5.43 | -5.96 | 50.00 | 0.02 | 0.03 | False |
| NIFTY | SL 50% + trail after 2x | train | 99 | -4.56 | -10.53 | 26.26 | -12.84 | 12.61 | 56.71 | -5.88 | -4.87 | -4.39 | 60.00 | 0.00 | – | False |
| NIFTY | SL 50% + trail after 2x | test | 70 | -5.15 | -10.65 | 25.71 | -12.93 | 12.97 | 26.57 | -6.46 | -0.58 | -3.70 | 23.33 | 0.00 | 0.00 | False |
| NIFTY | hold to settlement | train | 99 | -0.72 | -19.21 | 13.13 | -23.38 | 49.15 | 426.77 | -9.99 | -5.94 | -5.96 | 100.00 | 0.91 | – | False |
| NIFTY | hold to settlement | test | 70 | -8.14 | -20.45 | 14.29 | -24.23 | 26.42 | 207.18 | -14.85 | -2.81 | -8.79 | 60.00 | 0.08 | 0.10 | False |
| SENSEX | half 2x / half 3x or close | train | 98 | -13.99 | -24.09 | 14.29 | -27.98 | 25.57 | 30.72 | -15.39 | -15.08 | -14.78 | 66.67 | 0.00 | – | False |
| SENSEX | half 2x / half 3x or close | test | 68 | -11.80 | -22.95 | 17.65 | -26.81 | 28.49 | 32.89 | -13.85 | -10.29 | -11.22 | 30.00 | 0.00 | 0.00 | False |
| SENSEX | SL 50% + trail after 2x | train | 98 | -5.51 | -14.34 | 24.49 | -16.76 | 7.33 | 351.31 | -10.05 | -10.75 | -9.38 | 96.67 | 0.16 | – | False |
| SENSEX | SL 50% + trail after 2x | test | 68 | -8.87 | -14.05 | 22.06 | -15.70 | 11.13 | 18.35 | -10.08 | -5.08 | -6.62 | 13.33 | 0.00 | 0.00 | False |
| SENSEX | hold to settlement | train | 98 | -16.14 | -22.59 | 3.06 | -25.05 | -20.52 | 352.30 | -22.72 | -18.86 | -15.76 | 50.00 | 0.00 | – | False |
| SENSEX | hold to settlement | test | 68 | -6.38 | -22.31 | 5.88 | -25.18 | -18.87 | 591.71 | -21.71 | -0.81 | -10.63 | 66.67 | 0.53 | 0.53 | False |
Net option points per unit (Sensex rows are in Sensex points; divide by ≈3.3 for Nifty-equivalent). A row counts only if the test mean > 0, p < 0.05, q < 0.10, it beats random (≥90th percentile) and the with-trend control, the train mean > 0, and the mean without the top 3 is > 0.
Why “2×–3× happens 20–40% of the time” still loses money: the median trade loses most of the premium. Exit (a) wins only 1 trade in 4 to 6, and most of the rest expire near zero, so the 2× and 3× winners don't pay for them. Hold-to-settlement has rare huge winners (best +592 pts) but a win rate of 3–14%, and it is negative without the top 3. The p < 0.05 rows are significantly negative.
| set | ix | exit | n | mean | median | win | no_top3 | t_p | q_bh |
|---|---|---|---|---|---|---|---|---|---|
| band 10–30 | NIFTY | half 2x / half 3x or close | 70 | -6.20 | -17.65 | 22.86 | -8.02 | 0.01 | 0.03 |
| band 10–30 | NIFTY | SL 50% + trail after 2x | 70 | -5.37 | -10.35 | 24.29 | -6.69 | 0.00 | 0.00 |
| band 10–30 | NIFTY | hold to settlement | 70 | -8.19 | -20.20 | 12.86 | -14.91 | 0.08 | 0.13 |
| band 10–30 | SENSEX | half 2x / half 3x or close | 68 | -11.80 | -22.95 | 17.65 | -13.85 | 0.00 | 0.00 |
| band 10–30 | SENSEX | SL 50% + trail after 2x | 68 | -8.89 | -14.05 | 22.06 | -10.09 | 0.00 | 0.00 |
| band 10–30 | SENSEX | hold to settlement | 68 | -6.40 | -22.31 | 5.88 | -21.73 | 0.53 | 0.63 |
| Sensex scaled band | SENSEX | half 2x / half 3x or close | 68 | -14.33 | -60.74 | 29.41 | -19.94 | 0.10 | 0.16 |
| Sensex scaled band | SENSEX | SL 50% + trail after 2x | 68 | -9.53 | -34.54 | 26.47 | -18.83 | 0.16 | 0.23 |
| Sensex scaled band | SENSEX | hold to settlement | 68 | -16.59 | -63.21 | 17.65 | -43.13 | 0.36 | 0.44 |
| DECAY 15–25 | NIFTY | half 2x / half 3x or close | 64 | -5.74 | -17.65 | 29.69 | -7.80 | 0.04 | 0.07 |
| DECAY 15–25 | NIFTY | SL 50% + trail after 2x | 64 | -1.57 | -12.11 | 29.69 | -6.30 | 0.71 | 0.77 |
| DECAY 15–25 | NIFTY | hold to settlement | 64 | -5.69 | -22.80 | 17.19 | -15.09 | 0.35 | 0.44 |
| DECAY 15–25 | SENSEX | half 2x / half 3x or close | 63 | -11.50 | -25.75 | 20.63 | -13.85 | 0.00 | 0.00 |
| DECAY 15–25 | SENSEX | SL 50% + trail after 2x | 63 | -9.62 | -15.64 | 22.22 | -11.40 | 0.00 | 0.00 |
| DECAY 15–25 | SENSEX | hold to settlement | 63 | -11.91 | -25.84 | 3.17 | -25.35 | 0.36 | 0.44 |
| W1 09:35–11 | NIFTY | half 2x / half 3x or close | 60 | -6.39 | -18.55 | 23.33 | -8.54 | 0.02 | 0.04 |
| W1 09:35–11 | NIFTY | SL 50% + trail after 2x | 60 | -5.35 | -10.65 | 25.00 | -6.90 | 0.00 | 0.00 |
| W1 09:35–11 | NIFTY | hold to settlement | 60 | -9.24 | -20.30 | 13.33 | -15.76 | 0.05 | 0.09 |
| W1 09:35–11 | SENSEX | half 2x / half 3x or close | 61 | -11.05 | -22.70 | 18.03 | -13.31 | 0.00 | 0.00 |
| W1 09:35–11 | SENSEX | SL 50% + trail after 2x | 61 | -8.70 | -13.91 | 22.95 | -9.96 | 0.00 | 0.00 |
| W1 09:35–11 | SENSEX | hold to settlement | 61 | -4.40 | -22.19 | 6.56 | -21.48 | 0.70 | 0.77 |
| W2 11–13 | NIFTY | half 2x / half 3x or close | 55 | -3.74 | -17.25 | 34.55 | -6.00 | 0.23 | 0.31 |
| W2 11–13 | NIFTY | SL 50% + trail after 2x | 55 | 1.20 | -10.58 | 30.91 | -4.85 | 0.81 | 0.85 |
| W2 11–13 | NIFTY | hold to settlement | 55 | -2.34 | -19.02 | 21.82 | -11.22 | 0.71 | 0.77 |
| W2 11–13 | SENSEX | half 2x / half 3x or close | 55 | -10.11 | -23.55 | 25.45 | -12.50 | 0.00 | 0.01 |
| W2 11–13 | SENSEX | SL 50% + trail after 2x | 55 | -4.65 | -13.93 | 27.27 | -8.65 | 0.15 | 0.22 |
| W2 11–13 | SENSEX | hold to settlement | 55 | -3.27 | -22.34 | 5.45 | -22.44 | 0.85 | 0.87 |
| W3 13–14:30 | NIFTY | half 2x / half 3x or close | 50 | -6.20 | -17.57 | 28.00 | -8.82 | 0.03 | 0.06 |
| W3 13–14:30 | NIFTY | SL 50% + trail after 2x | 50 | -5.19 | -10.69 | 26.00 | -6.70 | 0.00 | 0.00 |
| W3 13–14:30 | NIFTY | hold to settlement | 50 | -6.91 | -19.42 | 20.00 | -15.10 | 0.20 | 0.27 |
| W3 13–14:30 | SENSEX | half 2x / half 3x or close | 55 | -11.15 | -23.25 | 21.82 | -13.76 | 0.00 | 0.00 |
| W3 13–14:30 | SENSEX | SL 50% + trail after 2x | 55 | -6.91 | -13.96 | 21.82 | -9.89 | 0.00 | 0.01 |
| W3 13–14:30 | SENSEX | hold to settlement | 55 | -1.25 | -22.04 | 7.27 | -19.31 | 0.91 | 0.91 |
| W4 14:30–15 | NIFTY | half 2x / half 3x or close | 32 | -10.65 | -18.42 | 18.75 | -14.76 | 0.00 | 0.00 |
| W4 14:30–15 | NIFTY | SL 50% + trail after 2x | 32 | -6.18 | -10.04 | 18.75 | -8.57 | 0.00 | 0.00 |
| W4 14:30–15 | NIFTY | hold to settlement | 32 | -10.25 | -17.92 | 15.62 | -16.06 | 0.01 | 0.02 |
| W4 14:30–15 | SENSEX | half 2x / half 3x or close | 42 | -10.50 | -21.57 | 23.81 | -13.48 | 0.00 | 0.01 |
| W4 14:30–15 | SENSEX | SL 50% + trail after 2x | 42 | -7.00 | -13.53 | 21.43 | -10.35 | 0.00 | 0.01 |
| W4 14:30–15 | SENSEX | hold to settlement | 42 | -13.94 | -21.74 | 7.14 | -22.51 | 0.02 | 0.04 |
| ix | exit | label | bucket | train_n | train_mean | test_n | test_mean | test_win | test_p | test w/o top 3 | q_bh |
|---|---|---|---|---|---|---|---|---|---|---|---|
| NIFTY | half 2x / half 3x or close | L3_ER20 | mid0.2-0.4 | 25 | -4.81 | 17 | -13.24 | 11.76 | 0.00 | -19.76 | 0.01 |
| NIFTY | SL 50% + trail after 2x | L2_DMA_trend | up | 42 | -1.00 | 21 | -7.02 | 19.05 | 0.00 | -10.26 | 0.01 |
| NIFTY | hold to settlement | L2_DMA_trend | up | 42 | 8.20 | 21 | -7.81 | 9.52 | 0.48 | -20.27 | 0.58 |
| SENSEX | half 2x / half 3x or close | L1_VIX | >16 | 16 | -8.91 | 23 | -9.08 | 21.74 | 0.06 | -15.04 | 0.09 |
| SENSEX | SL 50% + trail after 2x | L3_ER20 | mid0.2-0.4 | 34 | 0.03 | 19 | -9.08 | 21.05 | 0.00 | -13.47 | 0.01 |
| SENSEX | hold to settlement | L3_ER20 | mid0.2-0.4 | 34 | -4.64 | 19 | 9.25 | 5.26 | 0.78 | -23.46 | 0.78 |
The best train buckets were mostly still negative on train. The two that were positive on train both failed in 2026: Nifty DMA-trend up, hold to settlement (+8.2 → −7.8), and Sensex ER20 mid, trail (+0.0 → −9.1). The only positive test bucket (Sensex hold, +9.3, n=19) had a train mean of −4.6, wins on 1 of 19 trades, and is −23.5 without its top 3.
| ix | src | n | vol_known | sig_vol_zero_pct | fill_vol_zero_pct | fill_vol_median | fill_vol_p10 |
|---|---|---|---|---|---|---|---|
| NIFTY | by_expiry | 164 | 1 | 0 | 0 | 3,004,992 | 1,117,084 |
| NIFTY | eod_atm | 2 | 0 | 0 | 0 | 5,257,915 | 5,257,915 |
| NIFTY | opt_panels | 4 | 0 | – | – | – | – |
| SENSEX | by_expiry | 166 | 1 | 0 | 0 | 372,550 | 123,720 |
Every signal and fill bar had traded volume (median about 3.0M Nifty and 0.37M Sensex units at the fill minute), so the prints are real trades, not stale quotes. Bid/ask spreads are unknown (no history). On a 20-premium option a 0.5–1 pt spread is 2.5–5% per side, so real results would be somewhat worse than shown.
Files: ec_signals.csv (every signal with outcome) · ec_random.csv · ec_freq.csv · ec_primary.csv · ec_sens.csv · ec_regime.csv · ec_fills.csv · scripts s15_ec_cache.py, s16_ec.py, s17_ec_stats.py.
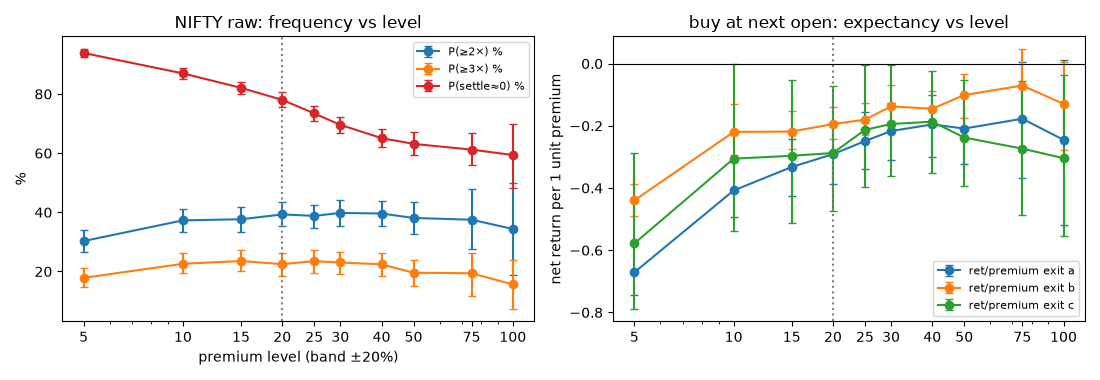
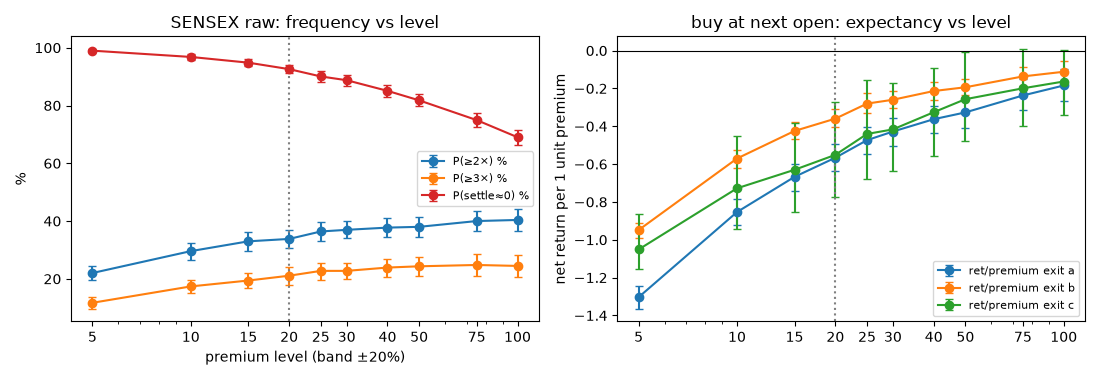
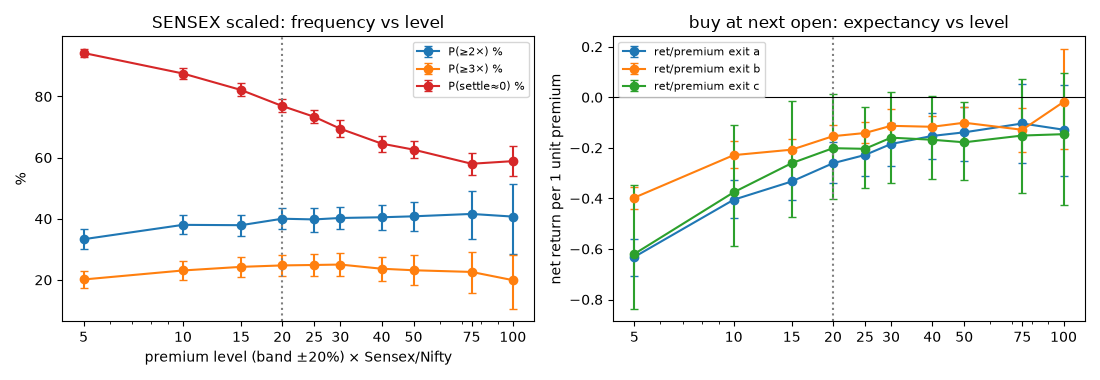
Added after Satya's 20:14 IST (27-Oct) follow-up: “but there is some thing with this 20 i think”. Design pre-registered at 20:20 IST in PREREG.md (WHY-20) before any number was computed. Same data and rules as the expiry section above: expiring contract, real 1m bars, spot 15:15–15:29 missing, official-close settlement, buyer only, next-open fill + slippage, full costs.
| ix | set | L | n | days | P(≥2×) % | P(≥3×) % | settle≈0 % | net/premium (a) | net/premium (b) | net/premium (c) | (a) train | (a) test |
|---|---|---|---|---|---|---|---|---|---|---|---|---|
| NIFTY | raw | 5 | 1519 | 108 | 30.28 | 17.84 | 93.88 | -0.67 | -0.44 | -0.58 | -0.70 | -0.63 |
| NIFTY | raw | 10 | 1274 | 108 | 37.28 | 22.61 | 86.97 | -0.41 | -0.22 | -0.31 | -0.43 | -0.37 |
| NIFTY | raw | 15 | 1134 | 108 | 37.65 | 23.54 | 82.10 | -0.33 | -0.22 | -0.30 | -0.35 | -0.30 |
| NIFTY | raw | 20 | 1046 | 108 | 39.29 | 22.47 | 78.01 | -0.29 | -0.19 | -0.29 | -0.28 | -0.31 |
| NIFTY | raw | 25 | 987 | 108 | 38.80 | 23.51 | 73.45 | -0.25 | -0.18 | -0.21 | -0.27 | -0.23 |
| NIFTY | raw | 30 | 907 | 108 | 39.80 | 23.04 | 69.57 | -0.22 | -0.14 | -0.19 | -0.23 | -0.20 |
| NIFTY | raw | 40 | 745 | 108 | 39.60 | 22.42 | 65.10 | -0.20 | -0.15 | -0.19 | -0.20 | -0.19 |
| NIFTY | raw | 50 | 567 | 96 | 38.10 | 19.58 | 63.14 | -0.21 | -0.10 | -0.24 | -0.21 | -0.21 |
| NIFTY | raw | 75 | 232 | 48 | 37.50 | 19.40 | 61.21 | -0.18 | -0.07 | -0.27 | -0.19 | -0.17 |
| NIFTY | raw | 100 | 96 | 19 | 34.38 | 15.62 | 59.38 | -0.25 | -0.13 | -0.30 | -0.42 | -0.08 |
| SENSEX | raw | 5 | 3260 | 104 | 22.02 | 11.72 | 98.99 | -1.30 | -0.95 | -1.05 | -1.36 | -1.19 |
| SENSEX | raw | 10 | 2669 | 104 | 29.60 | 17.38 | 96.82 | -0.85 | -0.57 | -0.73 | -0.91 | -0.74 |
| SENSEX | raw | 15 | 2440 | 104 | 32.99 | 19.43 | 94.84 | -0.67 | -0.42 | -0.63 | -0.72 | -0.55 |
| SENSEX | raw | 20 | 2309 | 104 | 33.82 | 21.09 | 92.59 | -0.57 | -0.36 | -0.55 | -0.62 | -0.45 |
| SENSEX | raw | 25 | 2214 | 104 | 36.40 | 22.76 | 90.06 | -0.47 | -0.28 | -0.44 | -0.53 | -0.35 |
| SENSEX | raw | 30 | 2126 | 104 | 36.97 | 22.77 | 88.76 | -0.43 | -0.26 | -0.42 | -0.50 | -0.29 |
| SENSEX | raw | 40 | 2003 | 104 | 37.74 | 23.91 | 85.07 | -0.36 | -0.21 | -0.33 | -0.41 | -0.26 |
| SENSEX | raw | 50 | 1889 | 104 | 38.01 | 24.35 | 81.79 | -0.33 | -0.19 | -0.26 | -0.38 | -0.23 |
| SENSEX | raw | 75 | 1697 | 104 | 40.01 | 24.81 | 74.96 | -0.24 | -0.14 | -0.20 | -0.28 | -0.16 |
| SENSEX | raw | 100 | 1540 | 104 | 40.39 | 24.48 | 69.03 | -0.18 | -0.11 | -0.16 | -0.21 | -0.14 |
| SENSEX | scaled | 5 | 2414 | 104 | 33.31 | 20.13 | 94.24 | -0.63 | -0.40 | -0.62 | -0.70 | -0.50 |
| SENSEX | scaled | 10 | 2084 | 104 | 38.00 | 23.08 | 87.52 | -0.41 | -0.23 | -0.38 | -0.46 | -0.30 |
| SENSEX | scaled | 15 | 1892 | 104 | 37.90 | 24.26 | 82.14 | -0.33 | -0.21 | -0.26 | -0.39 | -0.23 |
| SENSEX | scaled | 20 | 1787 | 104 | 40.01 | 24.73 | 76.89 | -0.26 | -0.15 | -0.20 | -0.29 | -0.21 |
| SENSEX | scaled | 25 | 1644 | 104 | 39.78 | 24.88 | 73.36 | -0.23 | -0.14 | -0.20 | -0.26 | -0.17 |
| SENSEX | scaled | 30 | 1555 | 104 | 40.26 | 25.02 | 69.45 | -0.18 | -0.11 | -0.16 | -0.21 | -0.14 |
| SENSEX | scaled | 40 | 1319 | 104 | 40.49 | 23.65 | 64.59 | -0.15 | -0.12 | -0.17 | -0.17 | -0.13 |
| SENSEX | scaled | 50 | 1054 | 100 | 40.80 | 23.15 | 62.62 | -0.14 | -0.10 | -0.18 | -0.13 | -0.15 |
| SENSEX | scaled | 75 | 469 | 54 | 41.58 | 22.60 | 58.00 | -0.10 | -0.13 | -0.15 | -0.10 | -0.13 |
| SENSEX | scaled | 100 | 226 | 22 | 40.71 | 19.91 | 58.85 | -0.13 | -0.02 | -0.15 | -0.09 | -0.40 |
Band ±20% around each level (20 = 16–24). Net/premium = net P&L ÷ fill; −0.29 means you lose on average 29% of the premium paid. Error bars and CIs are a 95% bootstrap over days. Sensex “scaled” = level × (Sensex open / Nifty open) ≈ ×3.3.
Is 20 an outlier vs a smooth curve fitted to the other 9 levels?
| ix | set | metric | at15 | at20 | at20_ci | at25 | smooth_fit_at20 | special |
|---|---|---|---|---|---|---|---|---|
| NIFTY | raw | P(≥2×) % | 37.654 | 39.293 | 35.2..43.6 | 38.804 | 39.159 | False |
| NIFTY | raw | P(≥3×) % | 23.545 | 22.467 | 18.6..26.3 | 23.506 | 23.605 | False |
| NIFTY | raw | P(settle≈0) % | 82.099 | 78.011 | 75.5..80.8 | 73.455 | 75.775 | False |
| NIFTY | raw | ret/premium exit a | -0.332 | -0.291 | -0.387..-0.196 | -0.249 | -0.271 | False |
| NIFTY | raw | ret/premium exit b | -0.218 | -0.194 | -0.244..-0.14 | -0.180 | -0.175 | False |
| NIFTY | raw | ret/premium exit c | -0.296 | -0.287 | -0.474..-0.072 | -0.213 | -0.228 | False |
| SENSEX | raw | P(≥2×) % | 32.992 | 33.824 | 30.6..36.8 | 36.405 | 34.661 | False |
| SENSEX | raw | P(≥3×) % | 19.426 | 21.091 | 17.9..24 | 22.764 | 21.366 | False |
| SENSEX | raw | P(settle≈0) % | 94.836 | 92.594 | 91.1..93.9 | 90.063 | 92.631 | False |
| SENSEX | raw | ret/premium exit a | -0.667 | -0.566 | -0.639..-0.492 | -0.473 | -0.563 | False |
| SENSEX | raw | ret/premium exit b | -0.425 | -0.360 | -0.404..-0.306 | -0.280 | -0.350 | False |
| SENSEX | raw | ret/premium exit c | -0.630 | -0.551 | -0.774..-0.271 | -0.441 | -0.514 | False |
| SENSEX | scaled | P(≥2×) % | 37.896 | 40.011 | 36.7..43.4 | 39.781 | 39.344 | False |
| SENSEX | scaled | P(≥3×) % | 24.260 | 24.734 | 21.3..28.3 | 24.878 | 24.681 | False |
| SENSEX | scaled | P(settle≈0) % | 82.135 | 76.889 | 74.8..79 | 73.358 | 75.754 | False |
| SENSEX | scaled | ret/premium exit a | -0.333 | -0.261 | -0.341..-0.176 | -0.228 | -0.258 | False |
| SENSEX | scaled | ret/premium exit b | -0.207 | -0.154 | -0.195..-0.108 | -0.141 | -0.168 | False |
| SENSEX | scaled | ret/premium exit c | -0.260 | -0.201 | -0.402..0.0123 | -0.204 | -0.231 | False |
| ix | set | L | round | n | low≥L−2 next 5m % | low≥L−2 next 15m % | low≥0.9L next 15m % | close>L after 15m % |
|---|---|---|---|---|---|---|---|---|
| NIFTY | raw | 10 | True | 1397 | 61.3 | 36.6 | 17.5 | 33.0 |
| NIFTY | raw | 17 | False | 1226 | 35.6 | 17.6 | 15.3 | 34.0 |
| NIFTY | raw | 18 | False | 1203 | 35.2 | 17.1 | 15.2 | 34.7 |
| NIFTY | raw | 20 | True | 1182 | 32.5 | 17.5 | 17.5 | 36.0 |
| NIFTY | raw | 22 | False | 1157 | 30.5 | 16.3 | 16.9 | 34.6 |
| NIFTY | raw | 23 | False | 1139 | 28.1 | 14.3 | 16.4 | 34.3 |
| NIFTY | raw | 25 | True | 1104 | 25.5 | 11.7 | 14.4 | 34.1 |
| NIFTY | raw | 30 | True | 1071 | 23.6 | 13.1 | 16.6 | 35.2 |
| NIFTY | raw | 50 | True | 864 | 12.5 | 6.0 | 12.4 | 29.3 |
| SENSEX | raw | 10 | True | 2999 | 62.4 | 38.8 | 18.6 | 32.7 |
| SENSEX | raw | 17 | False | 2642 | 37.7 | 19.4 | 16.2 | 33.7 |
| SENSEX | raw | 18 | False | 2602 | 37.5 | 18.9 | 16.9 | 34.4 |
| SENSEX | raw | 20 | True | 2559 | 31.8 | 15.3 | 15.3 | 33.6 |
| SENSEX | raw | 22 | False | 2502 | 29.8 | 15.2 | 15.9 | 33.3 |
| SENSEX | raw | 23 | False | 2470 | 28.5 | 13.4 | 15.0 | 34.4 |
| SENSEX | raw | 25 | True | 2423 | 27.5 | 13.2 | 15.5 | 35.3 |
| SENSEX | raw | 30 | True | 2340 | 22.4 | 10.7 | 14.1 | 33.7 |
| SENSEX | raw | 50 | True | 2089 | 17.7 | 9.7 | 16.4 | 36.8 |
| SENSEX | scaled | 10 | True | 2291 | 56.4 | 30.2 | 14.4 | 34.8 |
| SENSEX | scaled | 17 | False | 2035 | 32.7 | 17.1 | 14.6 | 35.5 |
| SENSEX | scaled | 18 | False | 2006 | 32.9 | 17.1 | 15.8 | 35.6 |
| SENSEX | scaled | 20 | True | 1950 | 30.8 | 14.7 | 14.7 | 36.0 |
| SENSEX | scaled | 22 | False | 1923 | 29.4 | 15.5 | 17.2 | 37.0 |
| SENSEX | scaled | 23 | False | 1899 | 25.6 | 13.9 | 15.9 | 36.3 |
| SENSEX | scaled | 25 | True | 1848 | 24.8 | 13.6 | 15.9 | 37.3 |
| SENSEX | scaled | 30 | True | 1767 | 23.5 | 12.2 | 16.5 | 35.9 |
| SENSEX | scaled | 50 | True | 1487 | 12.6 | 7.3 | 14.7 | 31.9 |
Round {10,20,25,30,50} minus non-round {17,18,22,23}, and 20 minus mean(17,18,22,23) (percentage points, 95% day-bootstrap CI):
| ix | set | metric | round_minus_nonround | ci | l20_minus_17_18_22_23 | ci20 |
|---|---|---|---|---|---|---|
| NIFTY | raw | hold5 | 1.11 | -0.6..2.7 | 0.06 | -2.5..2.7 |
| NIFTY | raw | hold15 | 2.11 | 0.7..3.6 | 1.13 | -1.2..3.5 |
| NIFTY | raw | hold15_pct | -0.03 | -1.4..1.2 | 1.56 | -0.9..3.8 |
| NIFTY | raw | up15 | -0.70 | -1.9..0.4 | 1.63 | -0.5..3.7 |
| SENSEX | raw | hold5 | 0.73 | -0.7..2.0 | -1.65 | -3.8..0.4 |
| SENSEX | raw | hold15 | 1.94 | 1.0..3.0 | -1.49 | -3.0..0.1 |
| SENSEX | raw | hold15_pct | 0.08 | -0.9..1.1 | -0.71 | -2.3..0.7 |
| SENSEX | raw | up15 | 0.31 | -0.6..1.2 | -0.32 | -1.9..1.1 |
| SENSEX | scaled | hold5 | 1.39 | 0.2..2.6 | 0.55 | -1.6..2.8 |
| SENSEX | scaled | hold15 | 0.67 | -0.4..1.8 | -1.28 | -3.2..0.5 |
| SENSEX | scaled | hold15_pct | -0.64 | -1.7..0.4 | -1.17 | -2.9..0.7 |
| SENSEX | scaled | up15 | -0.79 | -2.0..0.5 | -0.09 | -1.9..1.8 |
The fixed “low ≥ L−2” measure falls steadily with level: 61% at 10 and 33% at 20 (Nifty, 5 min). The round-number edge in that measure therefore comes from level 10, where −2 is a 20% cushion. With a fair tolerance (≥0.9L) every level is at 12–18% (Nifty), with no bump at 20. 20 vs its non-round neighbours: Nifty +1.1 points (CI −1.2..3.5), Sensex −1.5 (−3.0..0.1).
| ix | N | exit | split | n | mean | median | win | no_top3 | random_mean | random_pctile | p | q_bh_primary | counts |
|---|---|---|---|---|---|---|---|---|---|---|---|---|---|
| NIFTY | 10 | half 2× / half 3× or close | train | 81 | -10.11 | -26.26 | 28.40 | -13.47 | -6.91 | 0.00 | 0.01 | – | False |
| NIFTY | 10 | half 2× / half 3× or close | test | 71 | 5.09 | -1.14 | 42.25 | 1.27 | -0.05 | 100.00 | 0.26 | 0.85 | False |
| NIFTY | 10 | SL 50% + trail after 2× | train | 81 | -6.64 | -15.17 | 27.16 | -9.61 | -3.74 | 3.33 | 0.02 | – | False |
| NIFTY | 10 | SL 50% + trail after 2× | test | 71 | 3.29 | -14.09 | 35.21 | -5.74 | 1.03 | 80.00 | 0.57 | 0.85 | False |
| NIFTY | 10 | hold to settlement | train | 81 | -11.54 | -27.68 | 22.22 | -19.52 | -6.87 | 0.00 | 0.07 | – | False |
| NIFTY | 10 | hold to settlement | test | 71 | 4.43 | -24.62 | 28.17 | -5.20 | 2.11 | 76.67 | 0.56 | 0.85 | False |
| NIFTY | 20 | half 2× / half 3× or close | train | 66 | -11.10 | -19.79 | 31.82 | -14.97 | -2.99 | 0.00 | 0.02 | – | False |
| NIFTY | 20 | half 2× / half 3× or close | test | 51 | -0.28 | -1.17 | 43.14 | -4.47 | 2.71 | 3.33 | 0.96 | 0.96 | False |
| NIFTY | 20 | SL 50% + trail after 2× | train | 66 | -8.49 | -16.56 | 30.30 | -11.13 | -1.62 | 0.00 | 0.01 | – | False |
| NIFTY | 20 | SL 50% + trail after 2× | test | 51 | 9.25 | -15.99 | 41.18 | -3.77 | 3.31 | 96.67 | 0.29 | 0.85 | False |
| NIFTY | 20 | hold to settlement | train | 66 | -11.73 | -29.55 | 25.76 | -21.05 | -2.91 | 0.00 | 0.12 | – | False |
| NIFTY | 20 | hold to settlement | test | 51 | 6.83 | -21.02 | 33.33 | -6.39 | 4.95 | 80.00 | 0.51 | 0.85 | False |
| SENSEX | 10 | half 2× / half 3× or close | train | 114 | -12.13 | -29.70 | 24.56 | -14.88 | -12.15 | 50.00 | 0.00 | – | False |
| SENSEX | 10 | half 2× / half 3× or close | test | 76 | -6.43 | -27.70 | 30.26 | -10.61 | -7.51 | 80.00 | 0.17 | 0.85 | False |
| SENSEX | 10 | SL 50% + trail after 2× | train | 114 | -4.20 | -17.70 | 28.07 | -10.66 | -7.49 | 93.33 | 0.37 | – | False |
| SENSEX | 10 | SL 50% + trail after 2× | test | 76 | -7.25 | -17.07 | 28.95 | -10.67 | -5.19 | 13.33 | 0.02 | 0.22 | False |
| SENSEX | 10 | hold to settlement | train | 114 | -11.62 | -31.32 | 7.89 | -26.40 | -10.67 | 36.67 | 0.23 | – | False |
| SENSEX | 10 | hold to settlement | test | 76 | 0.84 | -29.99 | 9.21 | -24.26 | 0.18 | 56.67 | 0.96 | 0.96 | False |
| SENSEX | 20 | half 2× / half 3× or close | train | 91 | -13.68 | -31.85 | 23.08 | -19.15 | -9.76 | 3.33 | 0.03 | – | False |
| SENSEX | 20 | half 2× / half 3× or close | test | 67 | -4.41 | -28.05 | 29.85 | -11.45 | -5.31 | 76.67 | 0.49 | 0.85 | False |
| SENSEX | 20 | SL 50% + trail after 2× | train | 91 | -10.74 | -20.80 | 26.37 | -15.09 | -4.82 | 0.00 | 0.01 | – | False |
| SENSEX | 20 | SL 50% + trail after 2× | test | 67 | -2.94 | -18.60 | 25.37 | -11.87 | -2.45 | 46.67 | 0.63 | 0.85 | False |
| SENSEX | 20 | hold to settlement | train | 91 | -9.10 | -36.64 | 14.29 | -28.36 | -7.82 | 43.33 | 0.49 | – | False |
| SENSEX | 20 | hold to settlement | test | 67 | 3.53 | -31.84 | 10.45 | -27.64 | 5.23 | 36.67 | 0.86 | 0.96 | False |
A row counts only if the test mean > 0, p < 0.05, q < 0.10, it is ≥ 90th percentile vs random, the train mean > 0, the mean without the top 3 is > 0, and it beats the same construct at 15 and 25. Random = same window and side, option nearest the level, 30 repeats.
Same construct at every level (mean net pts per trade; Nifty and Sensex raw). 20 is the worst Nifty level on train and the best on test:
| ix | N | exit | split | 10 | 15 | 20 | 25 | 30 | 40 | 50 |
|---|---|---|---|---|---|---|---|---|---|---|
| NIFTY | 10 | SL 50% + trail after 2× | test | -4.70 | -7.57 | 3.29 | -0.97 | -3.41 | -3.88 | 14.73 |
| NIFTY | 10 | SL 50% + trail after 2× | train | -3.61 | 0.55 | -6.64 | 4.76 | -7.32 | 3.09 | 6.38 |
| NIFTY | 10 | half 2× / half 3× or close | test | -2.37 | -9.43 | 5.09 | -7.57 | -7.50 | -4.02 | -0.90 |
| NIFTY | 10 | half 2× / half 3× or close | train | -5.87 | -6.09 | -10.11 | -0.09 | -5.86 | -8.30 | -1.55 |
| NIFTY | 10 | hold to settlement | test | -6.61 | -9.20 | 4.43 | -9.03 | -9.88 | -6.65 | -7.46 |
| NIFTY | 10 | hold to settlement | train | 1.55 | 5.74 | -11.54 | 12.25 | -4.14 | -1.86 | -1.54 |
| NIFTY | 20 | SL 50% + trail after 2× | test | -6.52 | -9.01 | 9.25 | -7.61 | -3.00 | -11.22 | 7.71 |
| NIFTY | 20 | SL 50% + trail after 2× | train | -4.13 | 2.91 | -8.49 | 5.97 | -0.91 | -3.41 | 1.61 |
| NIFTY | 20 | half 2× / half 3× or close | test | -8.66 | -9.89 | -0.28 | -4.89 | -10.25 | 1.13 | -5.47 |
| NIFTY | 20 | half 2× / half 3× or close | train | -6.67 | -4.42 | -11.10 | 3.63 | -2.84 | -10.50 | 1.95 |
| NIFTY | 20 | hold to settlement | test | -7.08 | -8.47 | 6.83 | -5.35 | -8.39 | 3.62 | -3.22 |
| NIFTY | 20 | hold to settlement | train | 2.60 | 10.36 | -11.73 | 13.78 | -1.44 | -1.84 | 3.50 |
| SENSEX | 10 | SL 50% + trail after 2× | test | -5.03 | -4.77 | -7.25 | -7.30 | -8.58 | 3.21 | 3.36 |
| SENSEX | 10 | SL 50% + trail after 2× | train | -7.43 | -6.78 | -4.20 | -3.82 | -3.29 | -3.38 | -14.72 |
| SENSEX | 10 | half 2× / half 3× or close | test | -9.81 | -10.98 | -6.43 | -8.77 | -11.75 | -4.08 | -12.30 |
| SENSEX | 10 | half 2× / half 3× or close | train | -11.62 | -11.93 | -12.13 | -13.75 | -12.54 | -6.63 | -13.82 |
| SENSEX | 10 | hold to settlement | test | -1.62 | -1.77 | 0.84 | -25.25 | -6.24 | -7.70 | -1.28 |
| SENSEX | 10 | hold to settlement | train | -13.91 | -11.84 | -11.62 | -16.10 | -6.22 | -3.86 | -6.67 |
| SENSEX | 20 | SL 50% + trail after 2× | test | -3.62 | -6.15 | -2.94 | -10.79 | 8.35 | -4.25 | 13.29 |
| SENSEX | 20 | SL 50% + trail after 2× | train | -7.21 | -12.11 | -10.74 | -11.48 | -9.33 | 9.37 | -4.07 |
| SENSEX | 20 | half 2× / half 3× or close | test | -8.19 | -7.91 | -4.41 | -8.89 | -4.32 | -1.46 | -12.99 |
| SENSEX | 20 | half 2× / half 3× or close | train | -14.03 | -17.30 | -13.68 | -14.16 | -12.68 | 10.86 | -3.62 |
| SENSEX | 20 | hold to settlement | test | 5.55 | -2.97 | 3.53 | -25.97 | 9.07 | -1.51 | 8.77 |
| SENSEX | 20 | hold to settlement | train | -14.91 | -15.62 | -9.10 | -14.77 | -4.62 | 6.54 | 4.87 |
Time of day (Nifty, holds-at-20): most signals come before 11:00. That window loses on train (−10 to −15) and is about zero on test (−4.2 to +3.1). The 11:00–13:00 and 13:00–14:30 rows have 3–25 trades each and swing sign between train and test. See w20_holds_windows.csv. Sensitivity table (all levels, BH within the table): 20 of 114 test rows are positive and none is significant; the significant rows are negative.
Files: w20_scan_levels.csv · w20_scan_special.csv · w20_touch_levels.csv · w20_touch_round_vs_nonround.csv · w20_holds_summary.csv · w20_holds_by_level.csv · event files w20_scan / w20_touch / w20_holds(_random).csv · scripts s18_why20.py, s19_why20_stats.py, ec_lib.py.
Satya's follow-up at 20:29 IST (27-Oct): “20 without timevalue can you add that condition”. The design was pre-registered at 20:31 IST in PREREG.md (TWENTY-NO-TV). State: the option is ITM by 18–22 index points (intrinsic from the 1m spot close), its premium is 16–24, and its time value (premium − intrinsic) is between −2 and +2. Sensitivities: |TV| ≤ 1 and ≤ 10% of premium. Sensex is shown raw and scaled (levels × Sensex/Nifty open, ≈3.3). Delta ≈ 1, so the option roughly doubles on a ~20-point spot move. Signals run 9:35–15:00 only, because spot from 15:15 onward is missing and is not filled.
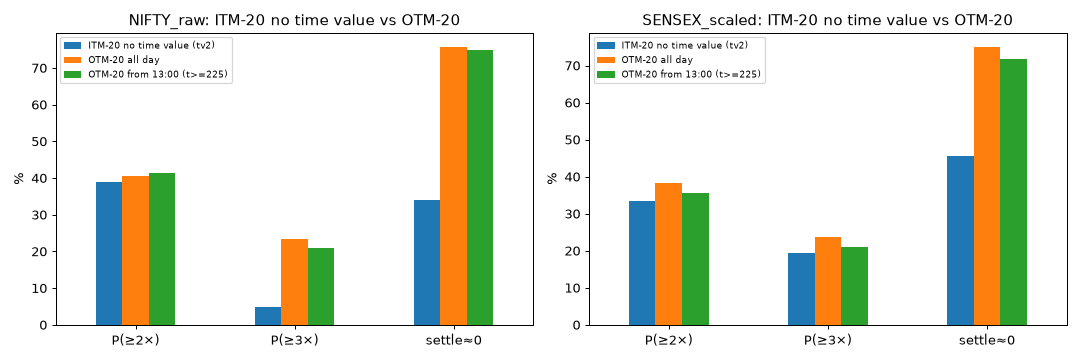
| what | grp | n | days | P(≥2×) % | P(≥3×) % | settle≈0 % | median min to peak | median signal minute (0=9:15) | net/premium (a) | net/premium (c) |
|---|---|---|---|---|---|---|---|---|---|---|
| ITM-20 no time value (tv2) | NIFTY_raw | 41.00 | 37.00 | 39.02 | 4.88 | 34.15 | 8.00 | 320.00 | -0.13 | -0.09 |
| OTM-20 all day | NIFTY_raw | 732.00 | 108.00 | 40.44 | 23.36 | 75.82 | 30.00 | 118.00 | -0.26 | -0.23 |
| OTM-20 from 13:00 (t>=225) | NIFTY_raw | 196.00 | 75.00 | 41.33 | 20.92 | 75.00 | 16.00 | 271.50 | -0.25 | -0.38 |
| ITM-20 no time value (tv2) | SENSEX_raw | 2.00 | 2.00 | 50.00 | 50.00 | 50.00 | 22.00 | 333.00 | 0.08 | 1.29 |
| OTM-20 all day | SENSEX_raw | 1,786.00 | 104.00 | 33.09 | 20.27 | 91.88 | 16.00 | 163.00 | -0.59 | -0.54 |
| OTM-20 from 13:00 (t>=225) | SENSEX_raw | 633.00 | 104.00 | 33.81 | 19.59 | 88.94 | 9.00 | 292.00 | -0.59 | -0.67 |
| ITM-20 no time value (tv2) | SENSEX_scaled | 57.00 | 43.00 | 33.33 | 19.30 | 45.61 | 7.00 | 323.00 | -0.19 | -0.01 |
| OTM-20 all day | SENSEX_scaled | 1,278.00 | 104.00 | 38.42 | 23.79 | 75.12 | 28.00 | 129.00 | -0.29 | -0.19 |
| OTM-20 from 13:00 (t>=225) | SENSEX_scaled | 371.00 | 82.00 | 35.58 | 21.02 | 71.70 | 15.00 | 279.00 | -0.34 | -0.35 |
By time-value definition:
| grp | tvdef | n | days | x2 | x3 | zero | peak_min_med | sig_time_med | tv_med |
|---|---|---|---|---|---|---|---|---|---|
| NIFTY_raw | tv1 | 26.0 | 24.0 | 50.0 | 11.5 | 38.5 | 14.0 | 305.0 | 0.1 |
| NIFTY_raw | tv10pct | 43.0 | 38.0 | 34.9 | 4.7 | 34.9 | 5.0 | 319.0 | 0.8 |
| NIFTY_raw | tv2 | 41.0 | 37.0 | 39.0 | 4.9 | 34.1 | 8.0 | 320.0 | 0.6 |
| SENSEX_raw | tv1 | 2.0 | 2.0 | 50.0 | 50.0 | 50.0 | 22.0 | 333.0 | -0.1 |
| SENSEX_raw | tv10pct | 2.0 | 2.0 | 50.0 | 50.0 | 50.0 | 22.0 | 333.0 | -0.1 |
| SENSEX_raw | tv2 | 2.0 | 2.0 | 50.0 | 50.0 | 50.0 | 22.0 | 333.0 | -0.1 |
| SENSEX_scaled | tv1 | 40.0 | 32.0 | 42.5 | 20.0 | 37.5 | 11.5 | 322.0 | 1.0 |
| SENSEX_scaled | tv10pct | 58.0 | 43.0 | 32.8 | 19.0 | 44.8 | 9.0 | 322.0 | 2.2 |
| SENSEX_scaled | tv2 | 57.0 | 43.0 | 33.3 | 19.3 | 45.6 | 7.0 | 323.0 | 2.2 |
By trend (same trend label as s16; counter = buying against the 20-minute move and the open):
| grp | mode | n | days | x2 | x3 | zero | peak_min_med | sig_time_med | tv_med |
|---|---|---|---|---|---|---|---|---|---|
| NIFTY_raw | counter | 13.0 | 13.0 | 46.2 | 0.0 | 46.2 | 15.0 | 300.0 | 0.8 |
| NIFTY_raw | neutral | 14.0 | 14.0 | 21.4 | 7.1 | 28.6 | 12.0 | 304.5 | 0.5 |
| NIFTY_raw | with | 14.0 | 13.0 | 50.0 | 7.1 | 28.6 | 3.0 | 322.0 | 0.4 |
| SENSEX_raw | neutral | 1.0 | 1.0 | 100.0 | 100.0 | 0.0 | 41.0 | 327.0 | 0.6 |
| SENSEX_raw | with | 1.0 | 1.0 | 0.0 | 0.0 | 100.0 | 3.0 | 339.0 | -0.7 |
| SENSEX_scaled | counter | 11.0 | 10.0 | 18.2 | 0.0 | 36.4 | 7.0 | 323.0 | 3.0 |
| SENSEX_scaled | neutral | 22.0 | 19.0 | 22.7 | 13.6 | 59.1 | 4.0 | 329.0 | 2.9 |
| SENSEX_scaled | with | 24.0 | 22.0 | 50.0 | 33.3 | 37.5 | 11.5 | 312.5 | 0.4 |
By window (W2 11:00–13:00, W3 13:00–14:30, W4 14:30–15:00; there were no W1 events):
| grp | win | n | days | x2 | x3 | zero | peak_min_med | sig_time_med | tv_med |
|---|---|---|---|---|---|---|---|---|---|
| NIFTY_raw | W2 | 7.0 | 7.0 | 28.6 | 0.0 | 57.1 | 29.0 | 189.0 | 0.4 |
| NIFTY_raw | W3 | 12.0 | 12.0 | 41.7 | 16.7 | 33.3 | 23.5 | 277.5 | 1.3 |
| NIFTY_raw | W4 | 22.0 | 21.0 | 40.9 | 0.0 | 27.3 | 3.0 | 337.5 | 0.5 |
| SENSEX_raw | W4 | 2.0 | 2.0 | 50.0 | 50.0 | 50.0 | 22.0 | 333.0 | -0.1 |
| SENSEX_scaled | W2 | 6.0 | 4.0 | 33.3 | 16.7 | 50.0 | 32.5 | 164.5 | 1.4 |
| SENSEX_scaled | W3 | 20.0 | 18.0 | 25.0 | 10.0 | 50.0 | 8.5 | 274.0 | 2.2 |
| SENSEX_scaled | W4 | 31.0 | 28.0 | 38.7 | 25.8 | 41.9 | 6.0 | 334.0 | 2.1 |
Exits: (a) half at 2×, rest at 3× or the 15:29 close. (b) Stop at fill − 10 (≈ spot 10 against), then trail 50% of peak once +20. (c) Hold to settlement intrinsic (official close). Spot control at the same minute and direction: (a') stop −20, half +20, rest +40 or the 15:14 spot close. (b') stop −10, trail 50% once +20. (c') stop −20, else the official close. Spot-control figures are after futures costs. Coin-flip = random direction at the same minute (1000 sims). The R1 random control (random minute in the same window, contract in the state) almost equals the signal, because the state usually lasts only 1–2 minutes, so it is not informative here.
| grp | mode | split | exit | n | mean | median | win | no_top3 | p | q_bh_primary | random_mean | spot_same_dir | spot_coinflip_mean | counts |
|---|---|---|---|---|---|---|---|---|---|---|---|---|---|---|
| NIFTY_raw | all | train | a | 35 | -3.23 | -13.92 | 40.00 | -6.44 | 0.40 | – | -2.70 | -14.70 | -7.94 | False |
| NIFTY_raw | all | train | b | 35 | -1.30 | -11.15 | 40.00 | -3.81 | 0.53 | – | -1.09 | -12.53 | -9.14 | False |
| NIFTY_raw | all | train | c | 35 | -1.30 | -13.20 | 37.14 | -6.23 | 0.80 | – | -0.93 | -15.48 | -10.50 | False |
| NIFTY_raw | all | test | a | 5 | -2.76 | 1.32 | 60.00 | -16.43 | 0.66 | 1.00 | -2.76 | -14.22 | -14.51 | False |
| NIFTY_raw | all | test | b | 5 | 0.86 | 1.68 | 60.00 | -11.25 | 0.88 | 1.00 | 0.86 | -22.13 | -14.81 | False |
| NIFTY_raw | all | test | c | 5 | -6.19 | -5.71 | 40.00 | -15.64 | 0.22 | 1.00 | -6.19 | -23.82 | -18.40 | False |
| NIFTY_raw | counter | train | a | 11 | -2.25 | -2.85 | 45.45 | -12.59 | 0.75 | – | -1.51 | -10.36 | -8.32 | False |
| NIFTY_raw | counter | train | b | 11 | 2.19 | 4.22 | 63.64 | -2.25 | 0.54 | – | -0.43 | -10.60 | -8.13 | False |
| NIFTY_raw | counter | train | c | 11 | -1.85 | -21.95 | 45.45 | -14.42 | 0.81 | – | -1.94 | -12.41 | -9.05 | False |
| NIFTY_raw | counter | test | a | 2 | 3.58 | 3.58 | 100.00 | – | – | 1.00 | 3.58 | 3.15 | -14.17 | False |
| NIFTY_raw | counter | test | b | 2 | 9.21 | 9.21 | 100.00 | – | – | 1.00 | 9.21 | -21.37 | -21.37 | False |
| NIFTY_raw | counter | test | c | 2 | -1.77 | -1.77 | 50.00 | – | – | 1.00 | -1.77 | -10.59 | -20.89 | False |
| NIFTY_raw | with | train | a | 11 | -0.54 | -6.88 | 45.45 | -10.40 | 0.93 | – | -0.06 | -11.60 | -7.22 | False |
| NIFTY_raw | with | train | b | 11 | -1.31 | -11.15 | 36.36 | -9.91 | 0.79 | – | -1.27 | -14.50 | -11.91 | False |
| NIFTY_raw | with | train | c | 11 | 2.00 | -6.06 | 36.36 | -10.91 | 0.80 | – | 2.53 | -15.63 | -11.96 | False |
| NIFTY_raw | with | test | a | 2 | -3.31 | -3.31 | 50.00 | – | – | 1.00 | -3.31 | -21.33 | -13.99 | False |
| NIFTY_raw | with | test | b | 2 | -1.42 | -1.42 | 50.00 | – | – | 1.00 | -1.42 | -21.58 | -7.89 | False |
| NIFTY_raw | with | test | c | 2 | -6.98 | -6.98 | 50.00 | – | – | 1.00 | -6.98 | -31.58 | -15.12 | False |
| SENSEX_scaled | all | train | a | 41 | -22.58 | -62.66 | 36.59 | -32.05 | 0.05 | – | -20.86 | -49.16 | -18.71 | False |
| SENSEX_scaled | all | train | b | 41 | -9.05 | -36.70 | 34.15 | -19.77 | 0.31 | – | -4.16 | -47.61 | -26.48 | False |
| SENSEX_scaled | all | train | c | 41 | -10.39 | -60.35 | 36.59 | -28.60 | 0.58 | – | -9.41 | -43.73 | -15.34 | False |
| SENSEX_scaled | all | test | a | 5 | 28.65 | 95.72 | 60.00 | -74.64 | 0.53 | 1.00 | 29.49 | -3.66 | -21.39 | False |
| SENSEX_scaled | all | test | b | 5 | 37.16 | 26.32 | 60.00 | -36.26 | 0.36 | 1.00 | 37.16 | -68.92 | -66.62 | False |
| SENSEX_scaled | all | test | c | 5 | 69.37 | 86.40 | 60.00 | -72.33 | 0.34 | 1.00 | 70.21 | 38.86 | 9.05 | False |
| SENSEX_scaled | counter | train | a | 8 | -27.57 | -36.36 | 37.50 | -60.19 | 0.16 | – | -27.47 | -53.98 | -23.04 | False |
| SENSEX_scaled | counter | train | b | 8 | -24.85 | -36.78 | 25.00 | -36.86 | 0.02 | – | -24.60 | -52.90 | -43.52 | False |
| SENSEX_scaled | counter | train | c | 8 | -26.87 | -33.58 | 37.50 | -57.88 | 0.15 | – | -26.57 | -63.52 | -32.20 | False |
| SENSEX_scaled | counter | test | a | 1 | -75.62 | -75.62 | 0.00 | – | – | 1.00 | -70.49 | -109.19 | -33.68 | False |
| SENSEX_scaled | counter | test | b | 1 | -36.00 | -36.00 | 0.00 | – | – | 1.00 | -35.99 | -77.15 | -77.15 | False |
| SENSEX_scaled | counter | test | c | 1 | -73.31 | -73.31 | 0.00 | – | – | 1.00 | -68.18 | -109.19 | 8.81 | False |
| SENSEX_scaled | with | train | a | 18 | -3.87 | -47.48 | 44.44 | -24.10 | 0.83 | – | -3.51 | -38.55 | -18.77 | False |
| SENSEX_scaled | with | train | b | 18 | 5.20 | -36.59 | 38.89 | -19.11 | 0.74 | – | 6.05 | -43.35 | -25.66 | False |
| SENSEX_scaled | with | train | c | 18 | 10.76 | -44.89 | 44.44 | -22.01 | 0.65 | – | 11.26 | -26.90 | -6.99 | False |
| SENSEX_scaled | with | test | a | 4 | 54.72 | 95.72 | 75.00 | -73.67 | 0.29 | 1.00 | 54.48 | 22.72 | -18.95 | False |
| SENSEX_scaled | with | test | b | 4 | 55.45 | 55.40 | 75.00 | -36.51 | 0.25 | 1.00 | 55.45 | -66.86 | -63.93 | False |
| SENSEX_scaled | with | test | c | 4 | 105.05 | 118.20 | 75.00 | -71.36 | 0.22 | 1.00 | 104.81 | 75.88 | 7.75 | False |
Spot/futures control before costs, and the futures cost (pts):
| grp | split | futures cost pts (round trip) | spot (a') before costs | spot (b') before costs | spot (c') before costs |
|---|---|---|---|---|---|
| NIFTY_raw | test | 11.63 | -2.59 | -10.50 | -12.19 |
| NIFTY_raw | train | 7.26 | -7.43 | -5.27 | -8.22 |
| SENSEX_raw | train | 19.65 | 4.25 | -11.50 | 28.12 |
| SENSEX_scaled | test | 35.18 | 31.51 | -33.74 | 74.04 |
| SENSEX_scaled | train | 21.59 | -27.57 | -26.02 | -22.14 |
All 2026 (test) trades. Sensex-scaled test means are positive only because of 3 winners out of 5; without the top 3 they are −36 to −75:
| grp | date | typ | t | mode | spot | K | ref | tv | fill | max_ratio | pnl_a | pnl_b | pnl_c | sa | sb | sc |
|---|---|---|---|---|---|---|---|---|---|---|---|---|---|---|---|---|
| NIFTY_raw | 2026-01-06 | PE | 323 | with | 26,131.1 | 26,150.0 | 17.2 | -1.7 | 17.4 | 1.1 | -18.5 | -11.2 | -17.8 | -28.1 | -18.1 | -28.1 |
| NIFTY_raw | 2026-02-17 | PE | 345 | counter | 25,730.7 | 25,750.0 | 21.1 | 1.9 | 21.6 | 1.7 | 1.3 | 1.7 | 2.2 | 4.9 | -18.0 | -2.7 |
| NIFTY_raw | 2026-04-21 | CE | 342 | with | 24,570.0 | 24,550.0 | 21.6 | 1.5 | 21.9 | 2.1 | 11.9 | 8.4 | 3.9 | -14.6 | -25.1 | -35.1 |
| NIFTY_raw | 2026-06-16 | PE | 345 | neutral | 23,978.8 | 24,000.0 | 22.9 | 1.8 | 23.6 | 1.1 | -14.4 | -11.3 | -13.5 | -34.7 | -24.7 | -34.7 |
| NIFTY_raw | 2026-07-28 | PE | 337 | counter | 23,981.6 | 24,000.0 | 19.2 | 0.8 | 19.6 | 3.0 | 5.9 | 16.7 | -5.7 | 1.4 | -24.7 | -18.5 |
| SENSEX_scaled | 2026-01-01 | CE | 334 | with | 85,270.2 | 85,200.0 | 69.7 | -0.5 | 70.2 | 1.2 | -73.7 | -36.5 | -71.4 | -89.0 | -56.4 | -89.0 |
| SENSEX_scaled | 2026-01-08 | PE | 326 | with | 84,333.5 | 84,400.0 | 63.5 | -2.9 | 66.3 | 4.2 | 95.7 | 147.5 | 150.0 | 75.3 | -56.1 | 129.0 |
| SENSEX_scaled | 2026-05-07 | PE | 343 | with | 77,940.0 | 78,000.0 | 63.4 | 3.4 | 66.4 | 3.5 | 95.7 | 84.5 | 86.4 | 52.3 | -77.6 | 50.0 |
| SENSEX_scaled | 2026-06-18 | PE | 342 | counter | 77,229.8 | 77,300.0 | 71.7 | 1.4 | 72.1 | 1.1 | -75.6 | -36.0 | -73.3 | -109.2 | -77.2 | -109.2 |
| SENSEX_scaled | 2026-07-30 | CE | 326 | with | 77,669.3 | 77,600.0 | 69.1 | -0.2 | 70.0 | 5.0 | 101.1 | 26.3 | 255.1 | 52.2 | -77.4 | 213.5 |
Regime filter chosen on train only (best single label with n ≥ 15), applied to test unchanged. With 3–5 test trades this proves nothing:
| grp | exit | filter | train_n | train_mean | test_n | test_mean |
|---|---|---|---|---|---|---|
| NIFTY_raw | a | L3_ER20=range<0.2 | 20 | 0.48 | 5 | -2.76 |
| NIFTY_raw | b | L3_ER20=range<0.2 | 20 | 2.20 | 5 | 0.86 |
| NIFTY_raw | c | L3_ER20=range<0.2 | 20 | 2.42 | 5 | -6.19 |
| SENSEX_scaled | a | L1_VIX=<13 | 17 | -6.08 | 3 | 41.05 |
| SENSEX_scaled | b | L1_VIX=<13 | 17 | 5.65 | 3 | 45.77 |
| SENSEX_scaled | c | L2_DMA_trend=up | 16 | 14.16 | 5 | 69.37 |
| grp | n | sig_vol_med | sig_vol_nan_or0 | fill_vol_med | fill_vol_nan_or0 | src_opt_panels | src_eod | negTV_contracts |
|---|---|---|---|---|---|---|---|---|
| NIFTY_raw | 41 | 9,451,650.0 | 0.0 | 9,161,800.0 | 0.0 | 0.0 | 0.0 | 12 |
| SENSEX_raw | 2 | 3,777,300.0 | 0.0 | 4,822,240.0 | 0.0 | 0.0 | 0.0 | 3 |
| SENSEX_scaled | 57 | 1,909,970.0 | 0.0 | 1,916,970.0 | 0.0 | 0.0 | 0.0 | 20 |
All signal and fill minutes had traded volume. The median volume at the signal minute is very high (about 9.5M units on Nifty), because these are near-ATM strikes in the last hour of expiry. Bid-ask spreads are unknown (there is no quote data). ITM spreads on expiry afternoons can be wider than the 0.5 / 1.5 slippage assumed. Time value is computed from the spot close against the option's last trade in the same minute, so it is noisy. 35 contracts were excluded at least once for printing more than 2 points below intrinsic.
Files: ntv_events.csv · ntv_trades.csv · ntv_summary.csv · ntv_vs_otm20.csv · ntv_freq*.csv · ntv_random.csv · ntv_regime.csv · ntv_fill.csv · ntv_spot_gross.csv · ntv_negtv.csv · scripts s20_notv.py, s21_notv_stats.py.
| # | Strategy | Rule as coded |
|---|---|---|
| P1 | ORB15 breakout | First 5m close beyond 09:15–09:29 range (09:30–12:00). Stop = other side of the range. |
| P2 | ORB5 first 5-min candle | First 5m close beyond the 09:15–09:19 candle (to 11:00). Stop = other side. |
| P3 | Prior-day high/low breakout | Day opens inside the prior-day range; first 5m close above PDH / below PDL (to 14:00). Stop = breakout bar extreme ±5. |
| P4 | Narrow-CPR breakout + VWAP | Narrow-CPR day only (width < 30th pct of last 250 days). First 5m close beyond CPR and on the same side of VWAP (09:30–12:00). Stop = other CPR edge. |
| P5 | Supertrend(10,3) flip + VWAP | 5m Supertrend(10,3) flips, confirmed by VWAP side (09:45–14:30). Stop = Supertrend line. |
| P6 | EMA 9/21 cross + VWAP | 5m EMA9 crosses EMA21, confirmed by VWAP side (09:45–14:30). Stop = 6-bar swing ±5. |
| P7 | RSI(14) 30/70 reversal | 5m RSI(14) crosses back above 30 (CE) / below 70 (PE) (09:45–14:30). Stop = 6-bar swing ±5. |
| P8 | Gap fade (gap-fill) | Gap 0.3–1.5%: first 5m close back through the 15-min range toward the gap fill (to 11:00) → buy against the gap. Stop = other side of range. |
Sources: stoxgo.in CPR guide, algoram.in “best NIFTY options buying strategy 2026”, tradingzenith.net “7 setups tested”, Ojha CPR playbook. The VWAP-pullback and with-gap ORB variants were already tested on the buyer-method audit.
Files: results · scripts · charts · pre-registration.