← Option pricing models & outliers · Research, not advice. Read-only; no orders.
Research, not advice. Read-only study on historical data; no orders were placed. Nothing here is a recommendation to trade.
Each minute, for the front and next weekly expiry, we fit one smooth SVI smile through the chain's implied volatilities (OTM strikes, vega-weighted). Put that smile's volatility back into Black-Scholes and you get a fair value for every strike. The gap = market price − fair value, in premium points, in % of fair, and in volatility points. A minute is flagged when the gap is unusual for that contract (robust z-score ≥4 against its own last 60 minutes, and ≥1 pt), or simply big (≥5 pts, ≥20% of fair, or ≥5 vol points). Back-to-back flagged minutes (≤3 min apart, same contract, same direction) count as one episode.
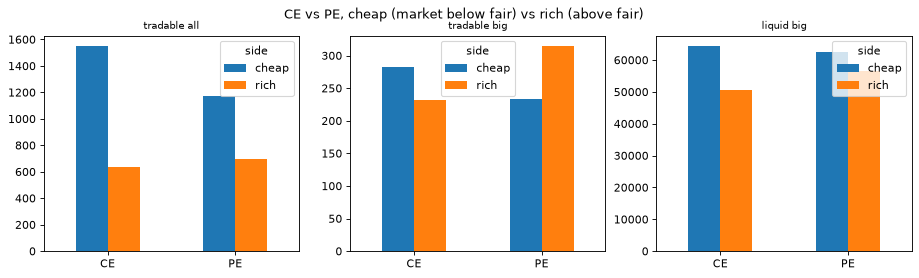
Cheap = market below fair; rich = market above fair. Costs used everywhere: lot 65, 1 pt slippage each side, ₹50 fees per round trip.
| tier | episodes | meaning |
|---|---|---|
| raw | 1,175,263 | any flagged gap, any strike |
| liquid | 267,393 | strike within ~4% of forward, after 09:15; option traded that minute and the next minute; price changed within the last 3 minutes; premium ≥1 |
| tradable | 4,055 | liquid, and the call/put at the same strike also traded and shows the same-direction gap (at least half the size) — so it is not just one stale print |
At the minute level, of 88,453 strong raw outlier minutes (|z|≥4, ≥1 pt): 67.4% had no trade that minute (the "price" is the last old trade), 52.3% had no trade the next minute either, 48.1% showed a price unchanged for 3+ minutes, and 98.5% were not confirmed by the put/call partner. Only 1,106 (1.3%) passed every check. So a raw "mismatch" is usually a stale last-trade price while spot and the rest of the chain moved on, not a price anyone could actually trade at.
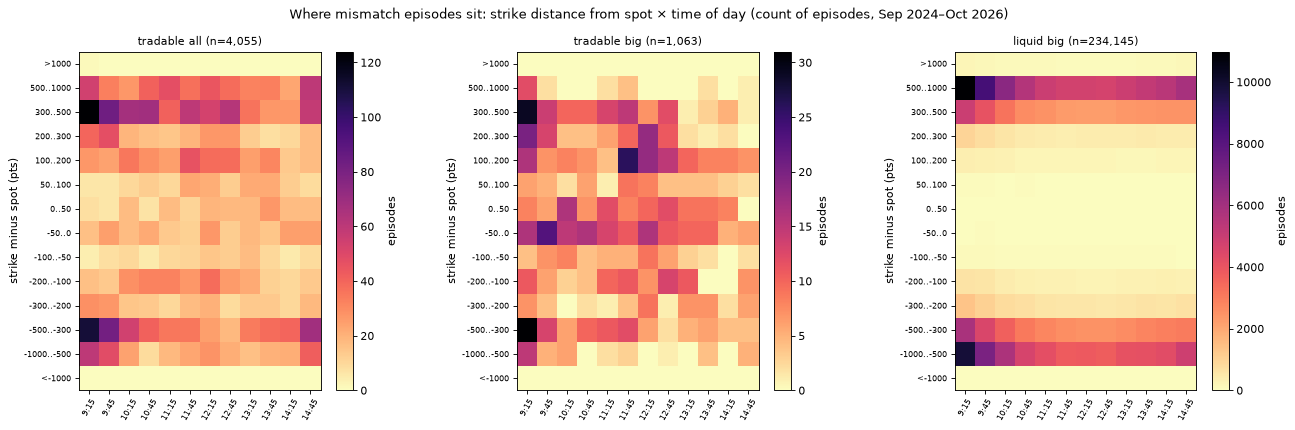
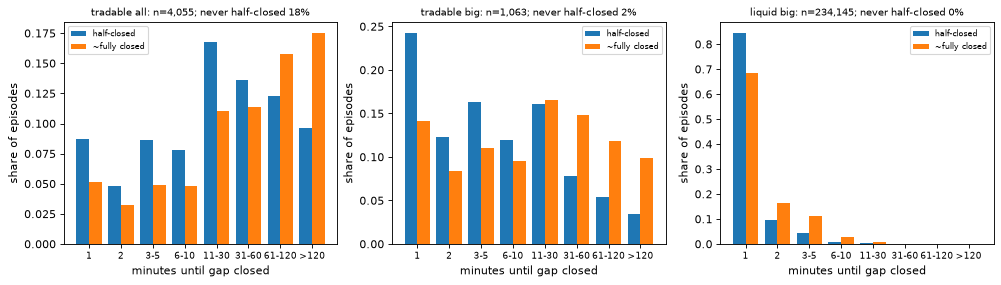
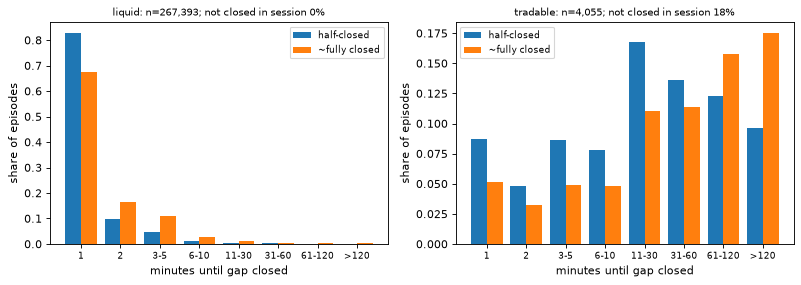
Liquid-but-unconfirmed gaps are mostly deep in-the-money strikes (99% of liquid ≥5-pt episodes are ITM; 58% are 500–1000 pts from spot). These close within one minute (84.6% halve in ≤1 min) — typical of thin, wide bid/ask prints bouncing, not a real mispricing.
| # | time (IST) | expiry | strike | type | market | SVI fair | gap | spot | volume that min | what happened next | |
|---|---|---|---|---|---|---|---|---|---|---|---|
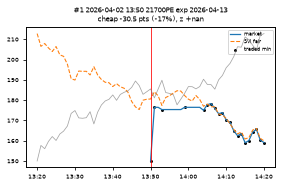
| 1 | 2026-04-02 13:50 | 2026-04-13 | 21700 | PE | OTM | 150.00 | 180.54 | -30.5 pts (-17%) cheap | 22540 | 130 | Gap halved in 1 min, closed in 2 min; the market price moved to the model (option +26.4, fair +3.6 pts). Option price 15 min after the episode began: +1.9 pts. |
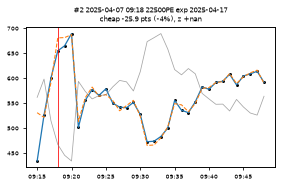
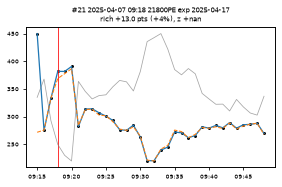
| 2 | 2025-04-07 09:18 | 2025-04-17 | 22500 | PE | ITM | 655.00 | 680.86 | -25.9 pts (-4%) cheap | 21914 | 42,075 | Gap halved in 2 min, closed in 2 min; the market price moved to the model (option +34.5, fair +6.5 pts). Option price 15 min after the episode began: -164.9 pts. |
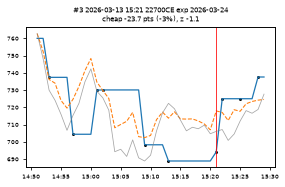
| 3 | 2026-03-13 15:21 | 2026-03-24 | 22700 | CE | ITM | 694.20 | 717.93 | -23.7 pts (-3%) cheap | 23150 | 130 | Gap halved in 1 min, closed in 1 min; the market price moved to the model (option +30.8, fair -0.9 pts). |
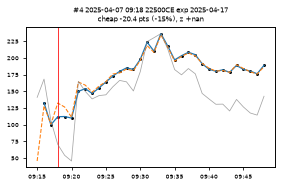
| 4 | 2025-04-07 09:18 | 2025-04-17 | 22500 | CE | OTM | 112.00 | 132.44 | -20.4 pts (-15%) cheap | 21914 | 43,050 | Gap halved in 2 min, closed in 2 min; the model moved to the market (spot/smile shifted) (option -2.0, fair -21.1 pts). Option price 15 min after the episode began: +105.6 pts. |
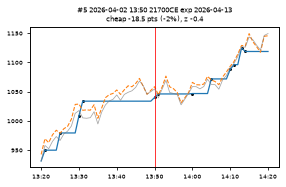
| 5 | 2026-04-02 13:50 | 2026-04-13 | 21700 | CE | ITM | 1040.15 | 1058.63 | -18.5 pts (-2%) cheap | 22540 | 65 | Gap halved in 1 min, closed in 1 min; the model moved to the market (spot/smile shifted) (option +6.0, fair -13.9 pts). Option price 15 min after the episode began: +25.7 pts. |
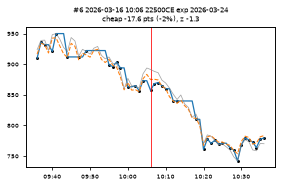
| 6 | 2026-03-16 10:06 | 2026-03-24 | 22500 | CE | ITM | 857.25 | 874.87 | -17.6 pts (-2%) cheap | 23205 | 65 | Gap halved in 1 min, closed in 2 min; the market price moved to the model (option +11.1, fair +0.6 pts). Option price 15 min after the episode began: -97.6 pts. |
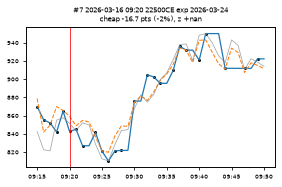
| 7 | 2026-03-16 09:20 | 2026-03-24 | 22500 | CE | ITM | 842.70 | 859.45 | -16.7 pts (-2%) cheap | 23165 | 650 | Gap halved in 1 min, closed in 1 min; the model moved to the market (spot/smile shifted) (option +2.3, fair -10.5 pts). Option price 15 min after the episode began: +64.8 pts. |
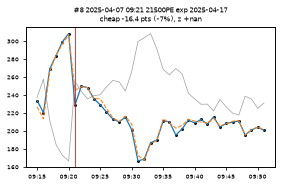
| 8 | 2025-04-07 09:21 | 2025-04-17 | 21500 | PE | OTM | 228.75 | 245.20 | -16.4 pts (-7%) cheap | 22065 | 106,200 | Gap halved in 1 min, closed in 1 min; the market price moved to the model (option +21.2, fair +4.1 pts). Option price 15 min after the episode began: -54.5 pts. |
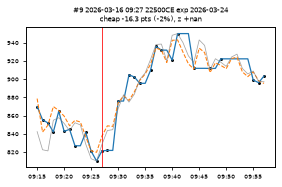
| 9 | 2026-03-16 09:27 | 2026-03-24 | 22500 | CE | ITM | 821.40 | 837.72 | -16.3 pts (-2%) cheap | 23140 | 650 | Gap halved in 3 min, closed in 3 min; the market price moved to the model (option +54.6, fair +36.5 pts). Option price 15 min after the episode began: +128.6 pts. |
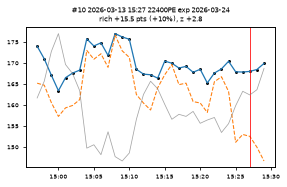
| 10 | 2026-03-13 15:27 | 2026-03-24 | 22400 | PE | OTM | 168.00 | 152.54 | +15.5 pts (+10%) rich | 23160 | 5,915 | Gap did not close before the session ended. |
"Volume that min" is in contracts (units), as in the source data. Full top-200 lists by points, %, vol points and z-score are in the CSVs below.
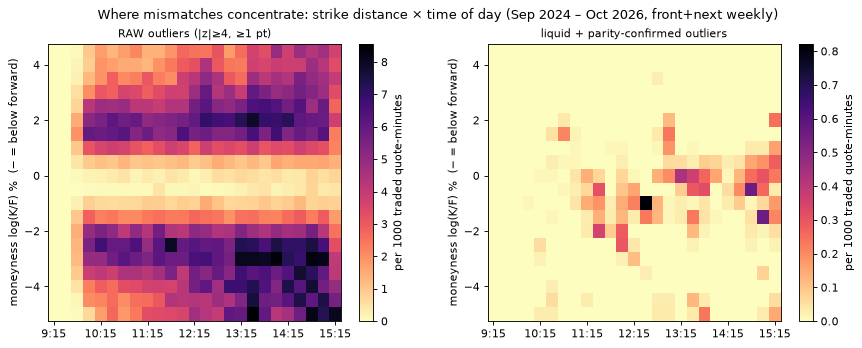
Rate view (per 1,000 traded quote-minutes, by moneyness):
A "big" 1-minute Nifty move here is ≥11.6 pts (3× the typical 3.9); 9.4% of all minutes are like that. A big 5-minute move is ≥25.5 pts (9.8% of minutes).
| set | episode minute had a big 1-min move | lift vs all minutes | came after a big 5-min move | lift |
|---|---|---|---|---|
| tradable, all | 19.9% | 2.11× | 21.0% | 2.14× |
| tradable, ≥5 pts | 33.8% | 3.58× | 32.0% | 3.26× |
| liquid, ≥5 pts | 26.4% | 2.80× | 21.8% | 2.22× |
Fast spot moves leave some option prices a minute behind; that is where the bigger tradable gaps come from.
Trading days in the window by news impact (from ./news calendar): none 353, low 57, medium 50, high 39.
| set | episodes/day: no news | low | medium | high-impact | within 60 min of a scheduled event (base 1.0% of minutes) |
|---|---|---|---|---|---|
| tradable, all | 8.17 | 7.05 | 3.66 | 15.05 | 3.1% |
| tradable, ≥5 pts | 2.34 | 0.81 | 0.16 | 4.69 | 3.0% |
| liquid, ≥5 pts | 456.05 | 387.23 | 492.82 | 678.15 | 1.6% |
High-impact days carry about 2× the tradable mismatches of a quiet day. Scheduled events (mostly RBI policy at ~10:00) show up 3× more than their share of minutes. But the single biggest tradable day had no tagged news, so news explains only part of it.
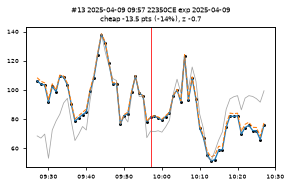
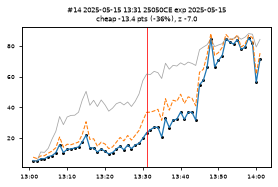
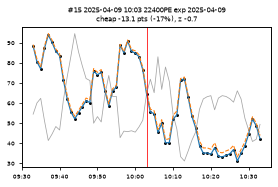
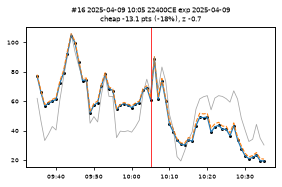
Tradable (all sizes) — the top 10 days hold 34.3% of all 4,055 episodes, spread over 204 days:
| date | episodes | largest gap (pts) | news that day |
|---|---|---|---|
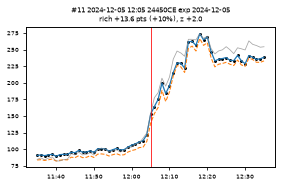
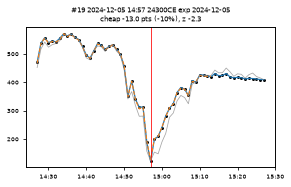
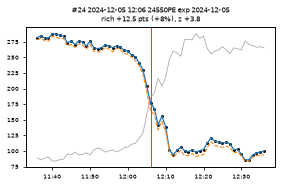
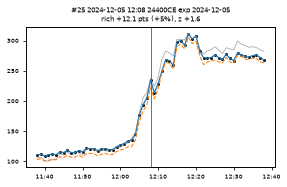
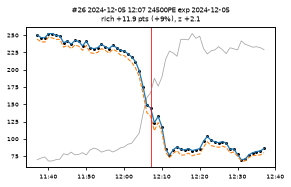
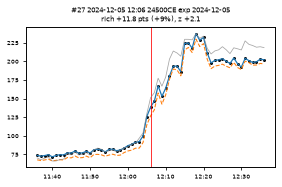
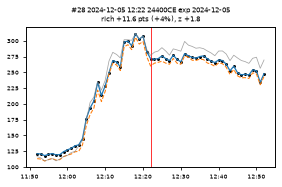
| 2024-12-05 | 420 | 13.600000381469727 | (quiet) (none) |
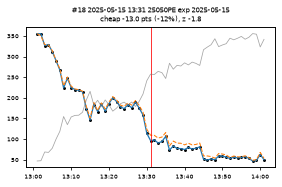
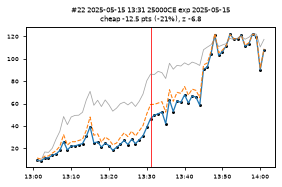
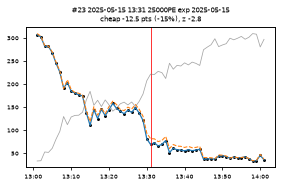
| 2025-05-15 | 193 | 13.399999618530273 | (quiet) (none) |
| 2025-04-17 | 139 | 10.300000190734863 | (quiet) (none) |
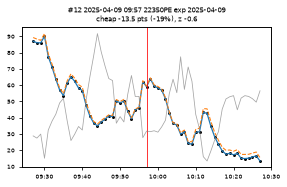
| 2025-04-09 | 120 | 13.5 | RBI MPC decision: Repo CUT 25bp to 6.00% ; Trump announces 90-day reciprocal-tariff pause (ex-China) late IST evening (high) |
| 2025-06-03 | 111 | 8.100000381469727 | (quiet) (none) |
| 2025-05-28 | 104 | 9.300000190734863 | (quiet) (none) |
| 2025-01-01 | 92 | 6.099999904632568 | (quiet) (none) |
| 2025-11-24 | 77 | 2.700000047683716 | (quiet) (none) |
| 2024-12-31 | 69 | 5.900000095367432 | (quiet) (none) |
| 2025-02-05 | 67 | 2.0999999046325684 | (quiet) (none) |
Liquid ≥5 pts — busiest days:
| date | episodes | largest gap (pts) | news that day |
|---|---|---|---|
| 2025-04-07 | 2131 | 137.3000030517578 | Global tariff crash: Sensex -2,227 (-2.95%) to 73,138, intraday -5.2% (high) |
| 2025-04-08 | 1923 | 40.599998474121094 | (quiet) (none) |
| 2026-02-01 | 1617 | 81.5999984741211 | Budget FY27 STT shock on F&O: Sensex -1,547 (-1.88%) to 80,723, ~Rs9.4 trn erased (high) |
| 2025-05-13 | 1450 | 46.400001525878906 | US CPI release (Apr 2025) (low) |
| 2026-03-09 | 1391 | 37.099998474121094 | Sensex -1,353 to 77,566 as Hormuz stays shut, Brent >$100 (high) |
| 2026-04-06 | 1385 | 33.79999923706055 | (quiet) (none) |
| 2026-03-16 | 1356 | 44.099998474121094 | (quiet) (none) |
| 2026-02-02 | 1348 | 35.29999923706055 | India-US trade deal announced after Trump-Modi call: US tariff 50% -> 18% (late IST) (high) |
| 2026-01-21 | 1344 | 43.900001525878906 | (quiet) (none) |
| 2025-04-25 | 1326 | 39.099998474121094 | Sensex -589 (intraday -1,000+) on LoC ceasefire violations, India-Pak escalation (medium) |
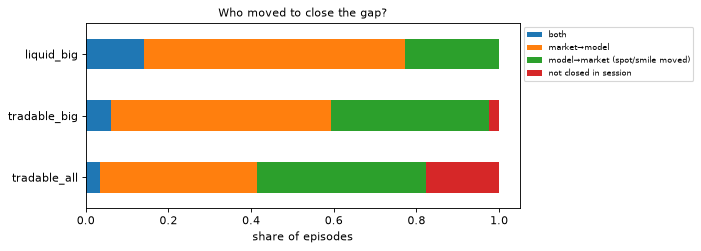
"Half-closed" = the gap fell to half its size or flipped sign; "closed" = down to a quarter (or 0.3 pts). "Market moved to model" = the option price did ≥67% of the closing; "model moved to market" = fair value did (spot or the smile shifted).
| set | episodes | half-closed ≤1 min | ≤5 min | ≤30 min | median min to half-close | median min to full close | never half-closed that day | market moved to model | model moved to market | both |
|---|---|---|---|---|---|---|---|---|---|---|
| tradable, all | 4,055 | 8.7% | 22.2% | 46.7% | 23 | 49 | 17.7% | 38.0% | 40.9% | 3.4% |
| tradable, ≥5 pts | 1,063 | 24.3% | 52.9% | 80.9% | 4 | 15 | 2.5% | 53.2% | 38.3% | 6.0% |
| liquid, ≥5 pts | 234,145 | 84.6% | 98.6% | 99.8% | 1 | 1 | 0.1% | 63.1% | 22.6% | 14.2% |
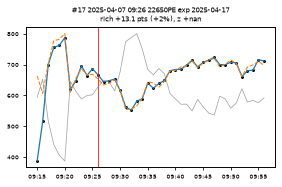
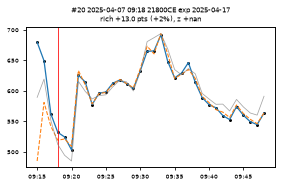
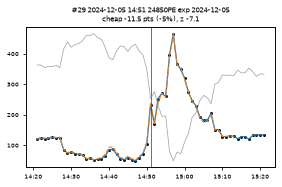
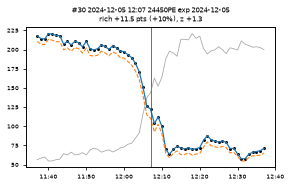
Each chart shows ±30 min: market price (solid), SVI fair (dashed), spot (grey, right side), dots = minutes the option traded, red line = the flagged minute. Click to enlarge.
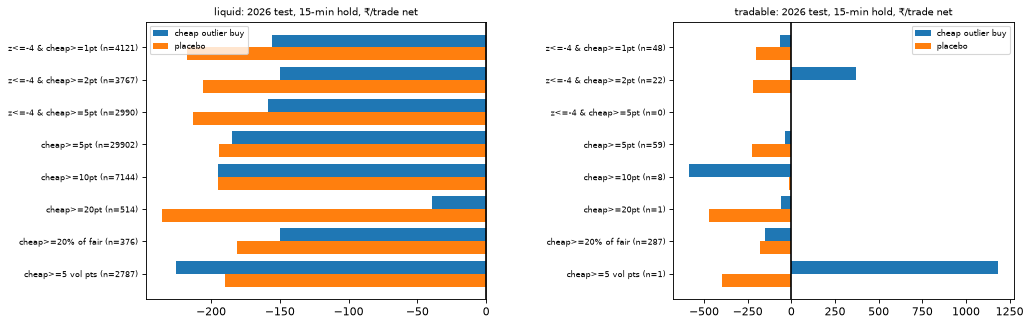
Rules (8 variants × 4 hold times × 2 tiers) were scored on train (Sep 2024–Jun 2025). The best on tune (Jul–Dec 2025, needing ≥20 trades) was picked per tier, then run once on the 2026 test. Entry is the minute after the signal, with the costs above. Placebo = random liquid quotes with the same CE/PE, moneyness, time-of-day and price bucket.
| tier | rule (picked on tune) | hold | period | trades | gross pts/trade | net ₹/trade | placebo ₹/trade | win rate [95% CI] | t vs placebo | total ₹ |
|---|---|---|---|---|---|---|---|---|---|---|
| liquid | cheap>=20pt | 15 min | train | 531 | -3.96 | ₹-437 | ₹-171 | 42% [38–46%] | -1.64 | ₹-232,172 |
| liquid | cheap>=20pt | 15 min | tune | 26 | +9.53 | ₹440 | ₹-113 | 50% [32–68%] | +1.47 | ₹11,428 |
| liquid | cheap>=20pt | 15 min | test | 514 | +2.17 | ₹-39 | ₹-236 | 47% [43–52%] | +1.43 | ₹-20,120 |
| tradable | cheap>=20% of fair | 1 min | train | 694 | +0.14 | ₹-171 | ₹-182 | 3% [2–5%] | +2.46 | ₹-118,669 |
| tradable | cheap>=20% of fair | 1 min | tune | 396 | +0.01 | ₹-179 | ₹-181 | 0% [0–1%] | +1.80 | ₹-70,998 |
| tradable | cheap>=20% of fair | 1 min | test | 303 | -0.03 | ₹-182 | ₹-179 | 0% [0–1%] | -1.78 | ₹-55,089 |
Verdict: FAIL for both tiers. Liquid "cheap ≥20 pts, hold 15 min" made money only in the small tune sample (26 trades) and lost ₹39/trade in test (it beat its placebo, but stayed negative). Tradable "cheap ≥20% of fair, hold 1 min" lost ₹182/trade with a 0% win rate in test: the gap (≈0 pts gross) is smaller than costs. The full grid is in buyer_test_all.csv. 8 of 64 2026 test cells show a profit, all in the tradable tier with tiny samples (1–61 trades). With 64 cells, a few positives are what chance alone produces, and none was the rule picked in advance, so they are not evidence of an edge.
top200_tradable_by_pts.csv · top200_tradable_by_pct.csv · top200_tradable_by_vol.csv · top200_tradable_by_z.csv · top200_liquid_by_pts.csv · top200_liquid_by_pct.csv · top200_liquid_by_vol.csv · top200_liquid_by_z.csv · top200_raw_by_pts.csv · top200_raw_by_pct.csv · top200_raw_by_vol.csv · top200_raw_by_z.csv · top20_per_month_tradable_by_pts.csv · top20_per_month_liquid_by_pts.csv · top20_per_month_raw_by_pts.csv · buyer_test_all.csv · buyer_test_selected.csv · clusters.json
Data: Upstox 1-minute Nifty weekly option OHLC/volume/OI (front + next expiry) and Nifty 1-minute spot; news from the in-house India daily news + events calendar. Times are IST. Built 2026-10-18. Research, not advice.